Deep Zoom Map
Every colored line is a real road segment. Green = safest, yellow = moderate, red = most dangerous. Zoom in to see individual streets in any US city.
8.7 million road segments colored by fatality rate per 100M vehicle-miles traveled
Scroll to zoom, drag to pan
National Overview
42,109
Deaths per year
2992T
Vehicle-miles/year
trillion
1.31
Deaths per 100M VMT
8.7M
Segments analyzed
Based on NHTSA FARS crash data (2021–2023) and FHWA HPMS road inventory. VMT = vehicle-miles traveled.
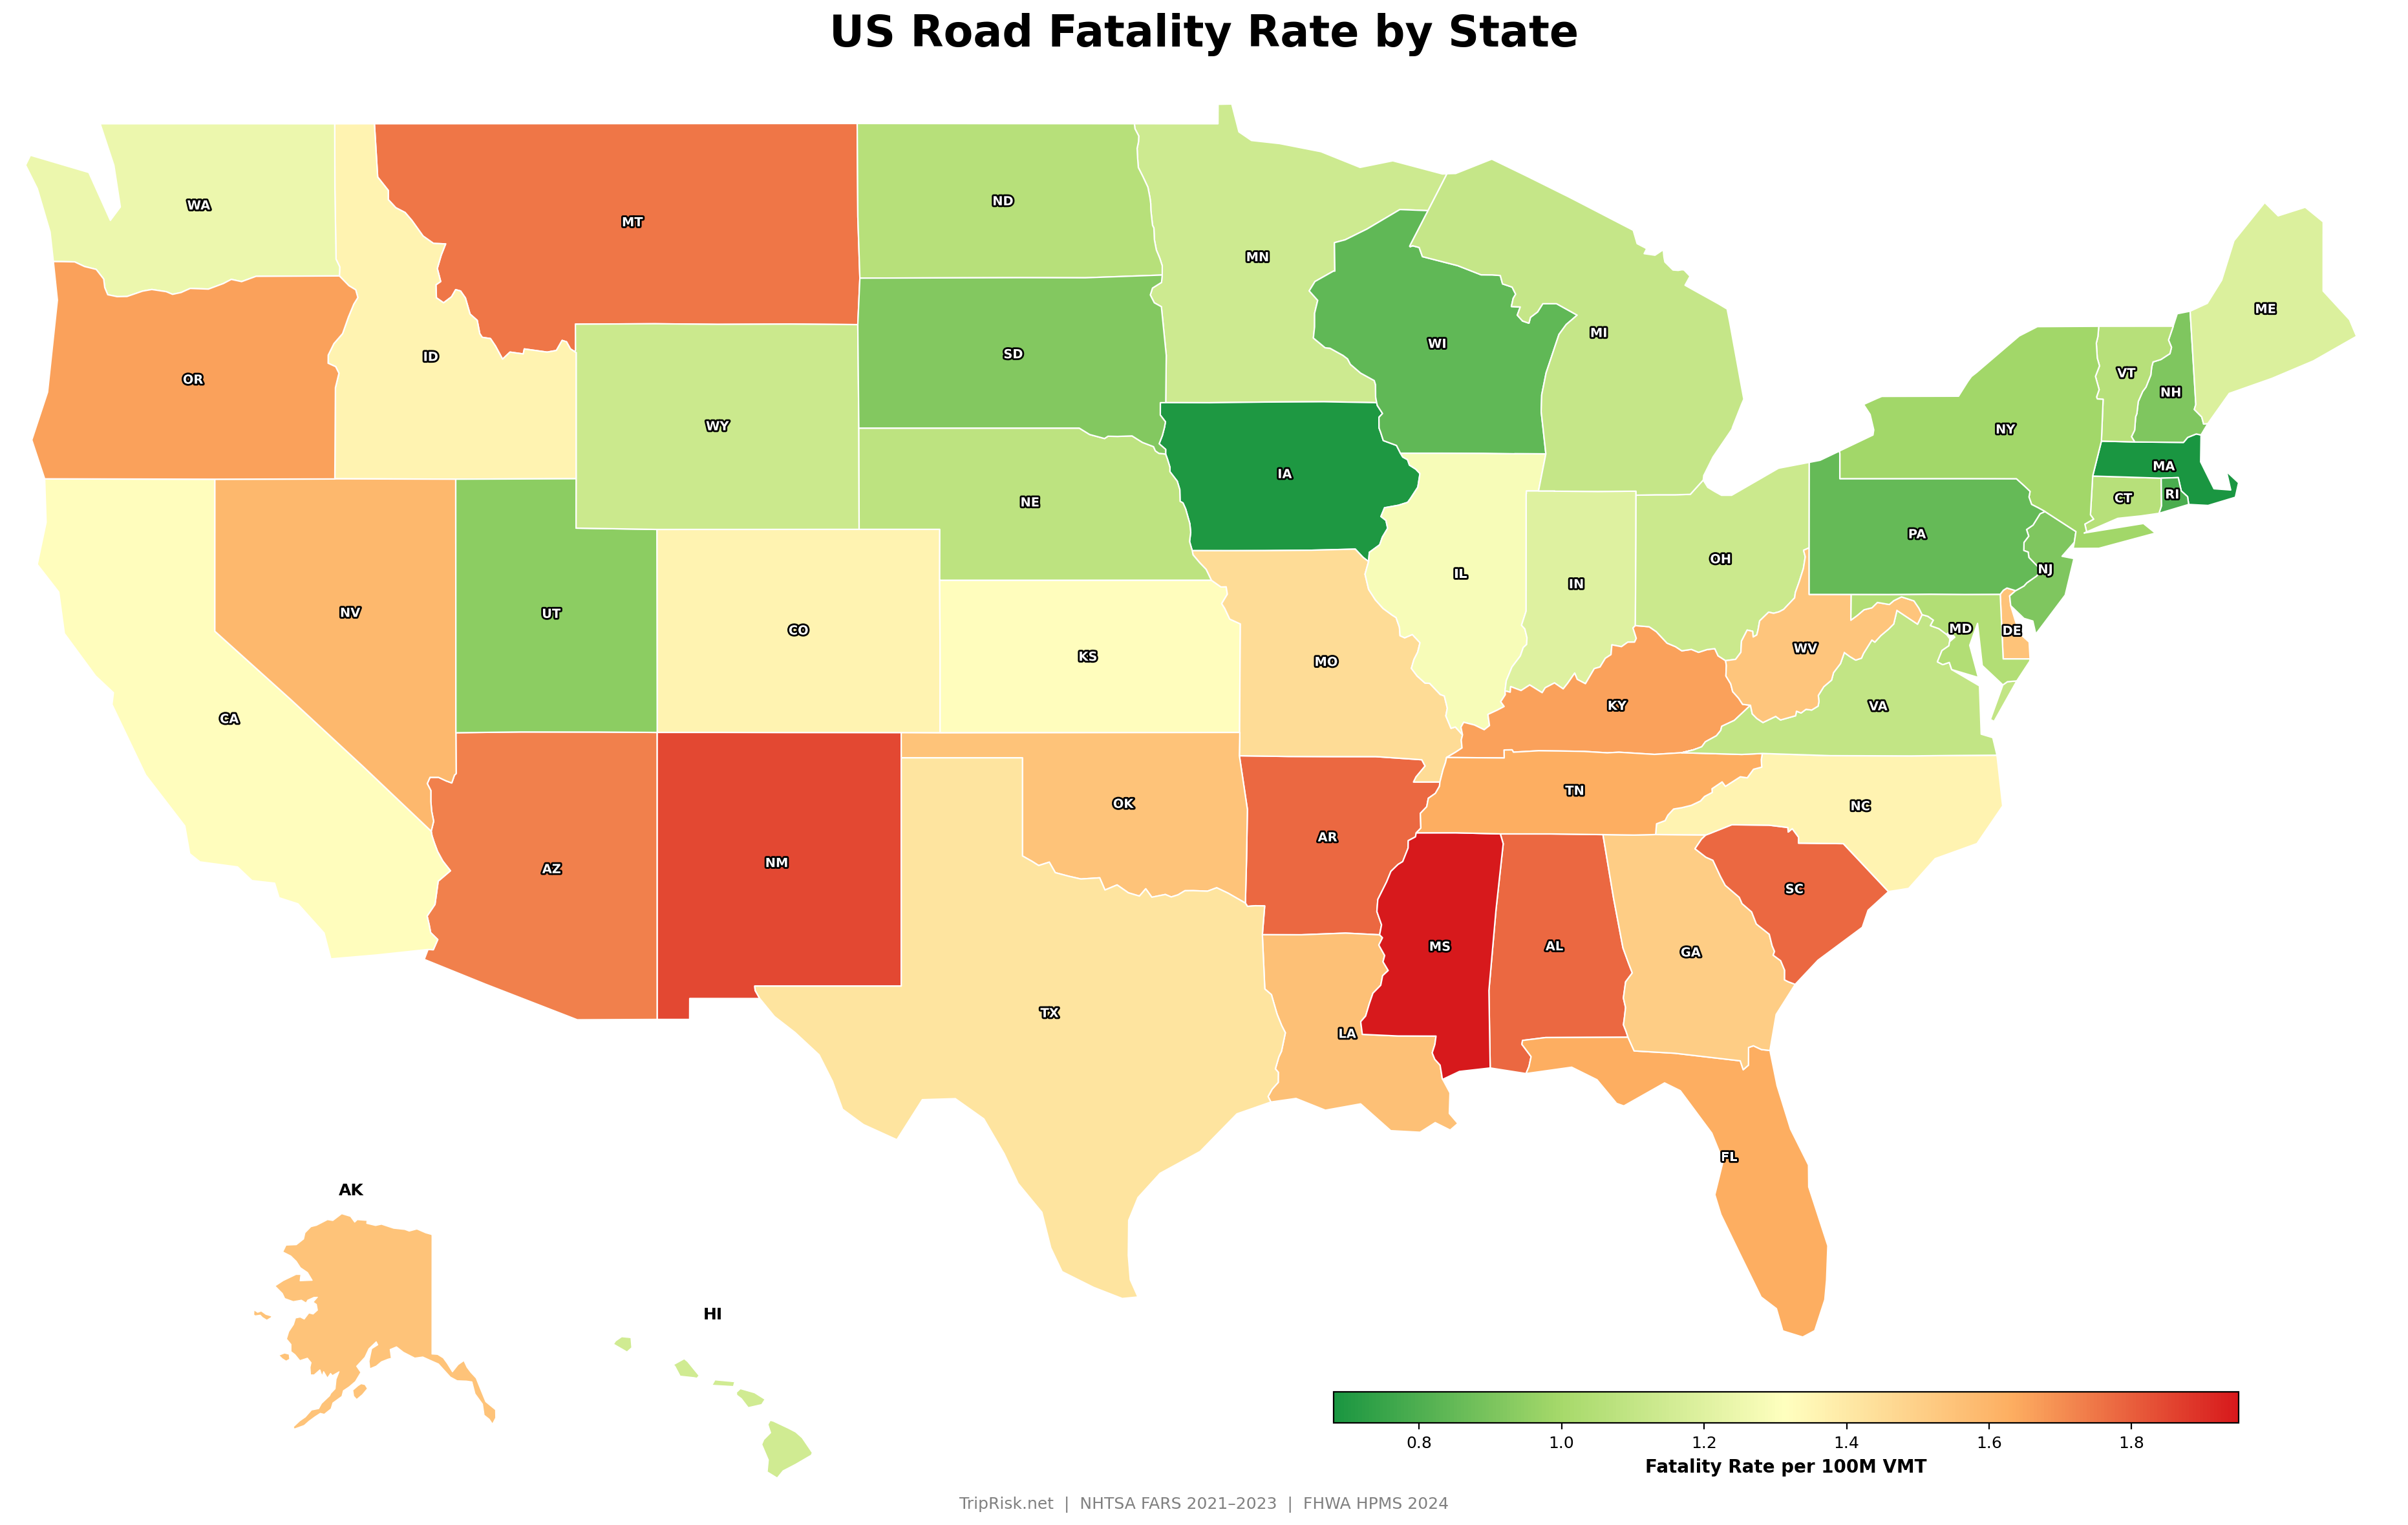
State Rankings
Fatality rate per 100 million vehicle-miles traveled, by state. Mississippi leads at 1.95 — nearly 3x the safest states.
Road Type Comparison
Interstates are the safest road type per mile driven, despite higher speeds. Controlled access, median barriers, and wide shoulders make the difference. Minor collectors are 5x more dangerous per VMT.
Speed Limit vs Fatality Rate
Counter-intuitively, mid-speed roads (40-45 mph) have the highest fatality rate. These are often undivided arterials with pedestrians, intersections, and no barriers — the worst combination of speed and exposure.
High-speed roads (65+ mph) are mostly limited-access highways with safety infrastructure that offsets the kinetic energy risk.
Metro Area Rankings
Per-capita traffic death rate for major US metro areas, based on FARS crash locations within ~40km of city center.
Deadliest Roads in America
Full roads ranked by total fatalities (2021–2023), broken at state lines. Interstates dominate by volume, but US highways in Florida have the highest per-mile death rates.
| # | Road | State | Length | Deaths/yr | Deaths (3yr) | Rate |
|---|---|---|---|---|---|---|
| 1 | I-5 | California | 1,510 mi | 178 | 534 | 0.73 |
| 2 | US-1 | Florida | 623 mi | 147 | 441 | 2.72 |
| 3 | US-101 | California | 1,527 mi | 141 | 424 | 0.68 |
| 4 | US-41 | Florida | 495 mi | 119 | 358 | 2.81 |
| 5 | SR-99 | California | 791 mi | 116 | 348 | 1.1 |
| 6 | I-10 | Texas | 2,050 mi | 113 | 340 | 0.69 |
| 7 | I-45 | Texas | 867 mi | 96 | 289 | 0.89 |
| 8 | I-35 | Texas | 1,290 mi | 95 | 286 | 0.68 |
| 9 | I-15 | California | 483 mi | 92 | 277 | 0.78 |
| 10 | I-95 | Florida | 732 mi | 88 | 263 | 0.52 |
| 11 | I-10 | California | 513 mi | 88 | 263 | 0.79 |
| 12 | US-27 | Florida | 537 mi | 84 | 253 | 2.35 |
| 13 | I-20 | Texas | 1,762 mi | 84 | 253 | 0.75 |
| 14 | I-10 | Arizona | 1,040 mi | 79 | 238 | 0.84 |
| 15 | I-75 | Florida | 773 mi | 78 | 233 | 0.54 |
| 16 | I-10 | Louisiana | 880 mi | 72 | 217 | 0.9 |
| 17 | I-75 | Georgia | 804 mi | 69 | 208 | 0.55 |
| 18 | US-17 | Florida | 360 mi | 63 | 188 | 2.24 |
| 19 | US-98 | Florida | 530 mi | 61 | 184 | 1.72 |
| 20 | US-19 | Florida | 317 mi | 61 | 182 | 2.39 |
Rate = fatalities per 100M vehicle-miles traveled. Lower is safer.
Key Findings
Mississippi has the highest fatality rate
1.95 deaths per 100M vehicle-miles traveled — the highest of any US state.
Massachusetts is the safest state to drive
Only 0.68 deaths per 100M VMT — roughly 2.9× safer than Mississippi.
Interstates are the safest road type
At 0.4 deaths per 100M VMT, interstates are 5.4× safer than minor collectors (2.15).
One traffic death every 12 minutes
The US averages 42,109 traffic fatalities per year — one death roughly every 12 minutes, 24/7.
40–45 mph roads are the deadliest per mile driven
Roads with 40–45 mph speed limits have a fatality rate of 1.47 per 100M VMT — 3.2× higher than 70–75 mph roads.
Memphis leads in per-capita traffic deaths
22.3 deaths per 100K residents — the highest among major US metro areas.
Plan a safer route
Enter any two US addresses and compare the fastest vs safest driving route.
Explore the risk map
Pan and zoom the full interactive map with road-level risk coloring anywhere in the US.
Data Sources
- NHTSA FARS — Fatality Analysis Reporting System, 2021–2023. All police-reported fatal motor vehicle crashes in the US.
- FHWA HPMS — Highway Performance Monitoring System, 2024. Road inventory with AADT, speed limits, and functional classification for 8.7M segments.
- US Census Bureau — 2023 population estimates by state.
For full methodology details, see the methodology page.