The Deadliest and Safest Cities to Drive In
America's 50 largest cities ranked by how dangerous they are to drive in. Memphis is the most dangerous city to drive in. Minneapolis is the safest city for driving.
How it was measured
We measured car and truck occupant deaths per 100 million miles driven to control for population density and the number of drivers on the road.
Each city is defined by its 2020 Census urban area, not by strict city bounds. Vehicle fatalities are from NHTSA FARS (2021–2024); traffic volume is from FHWA's 2024 highway inventory. Pedestrians, cyclists, and motorcyclists are not included.
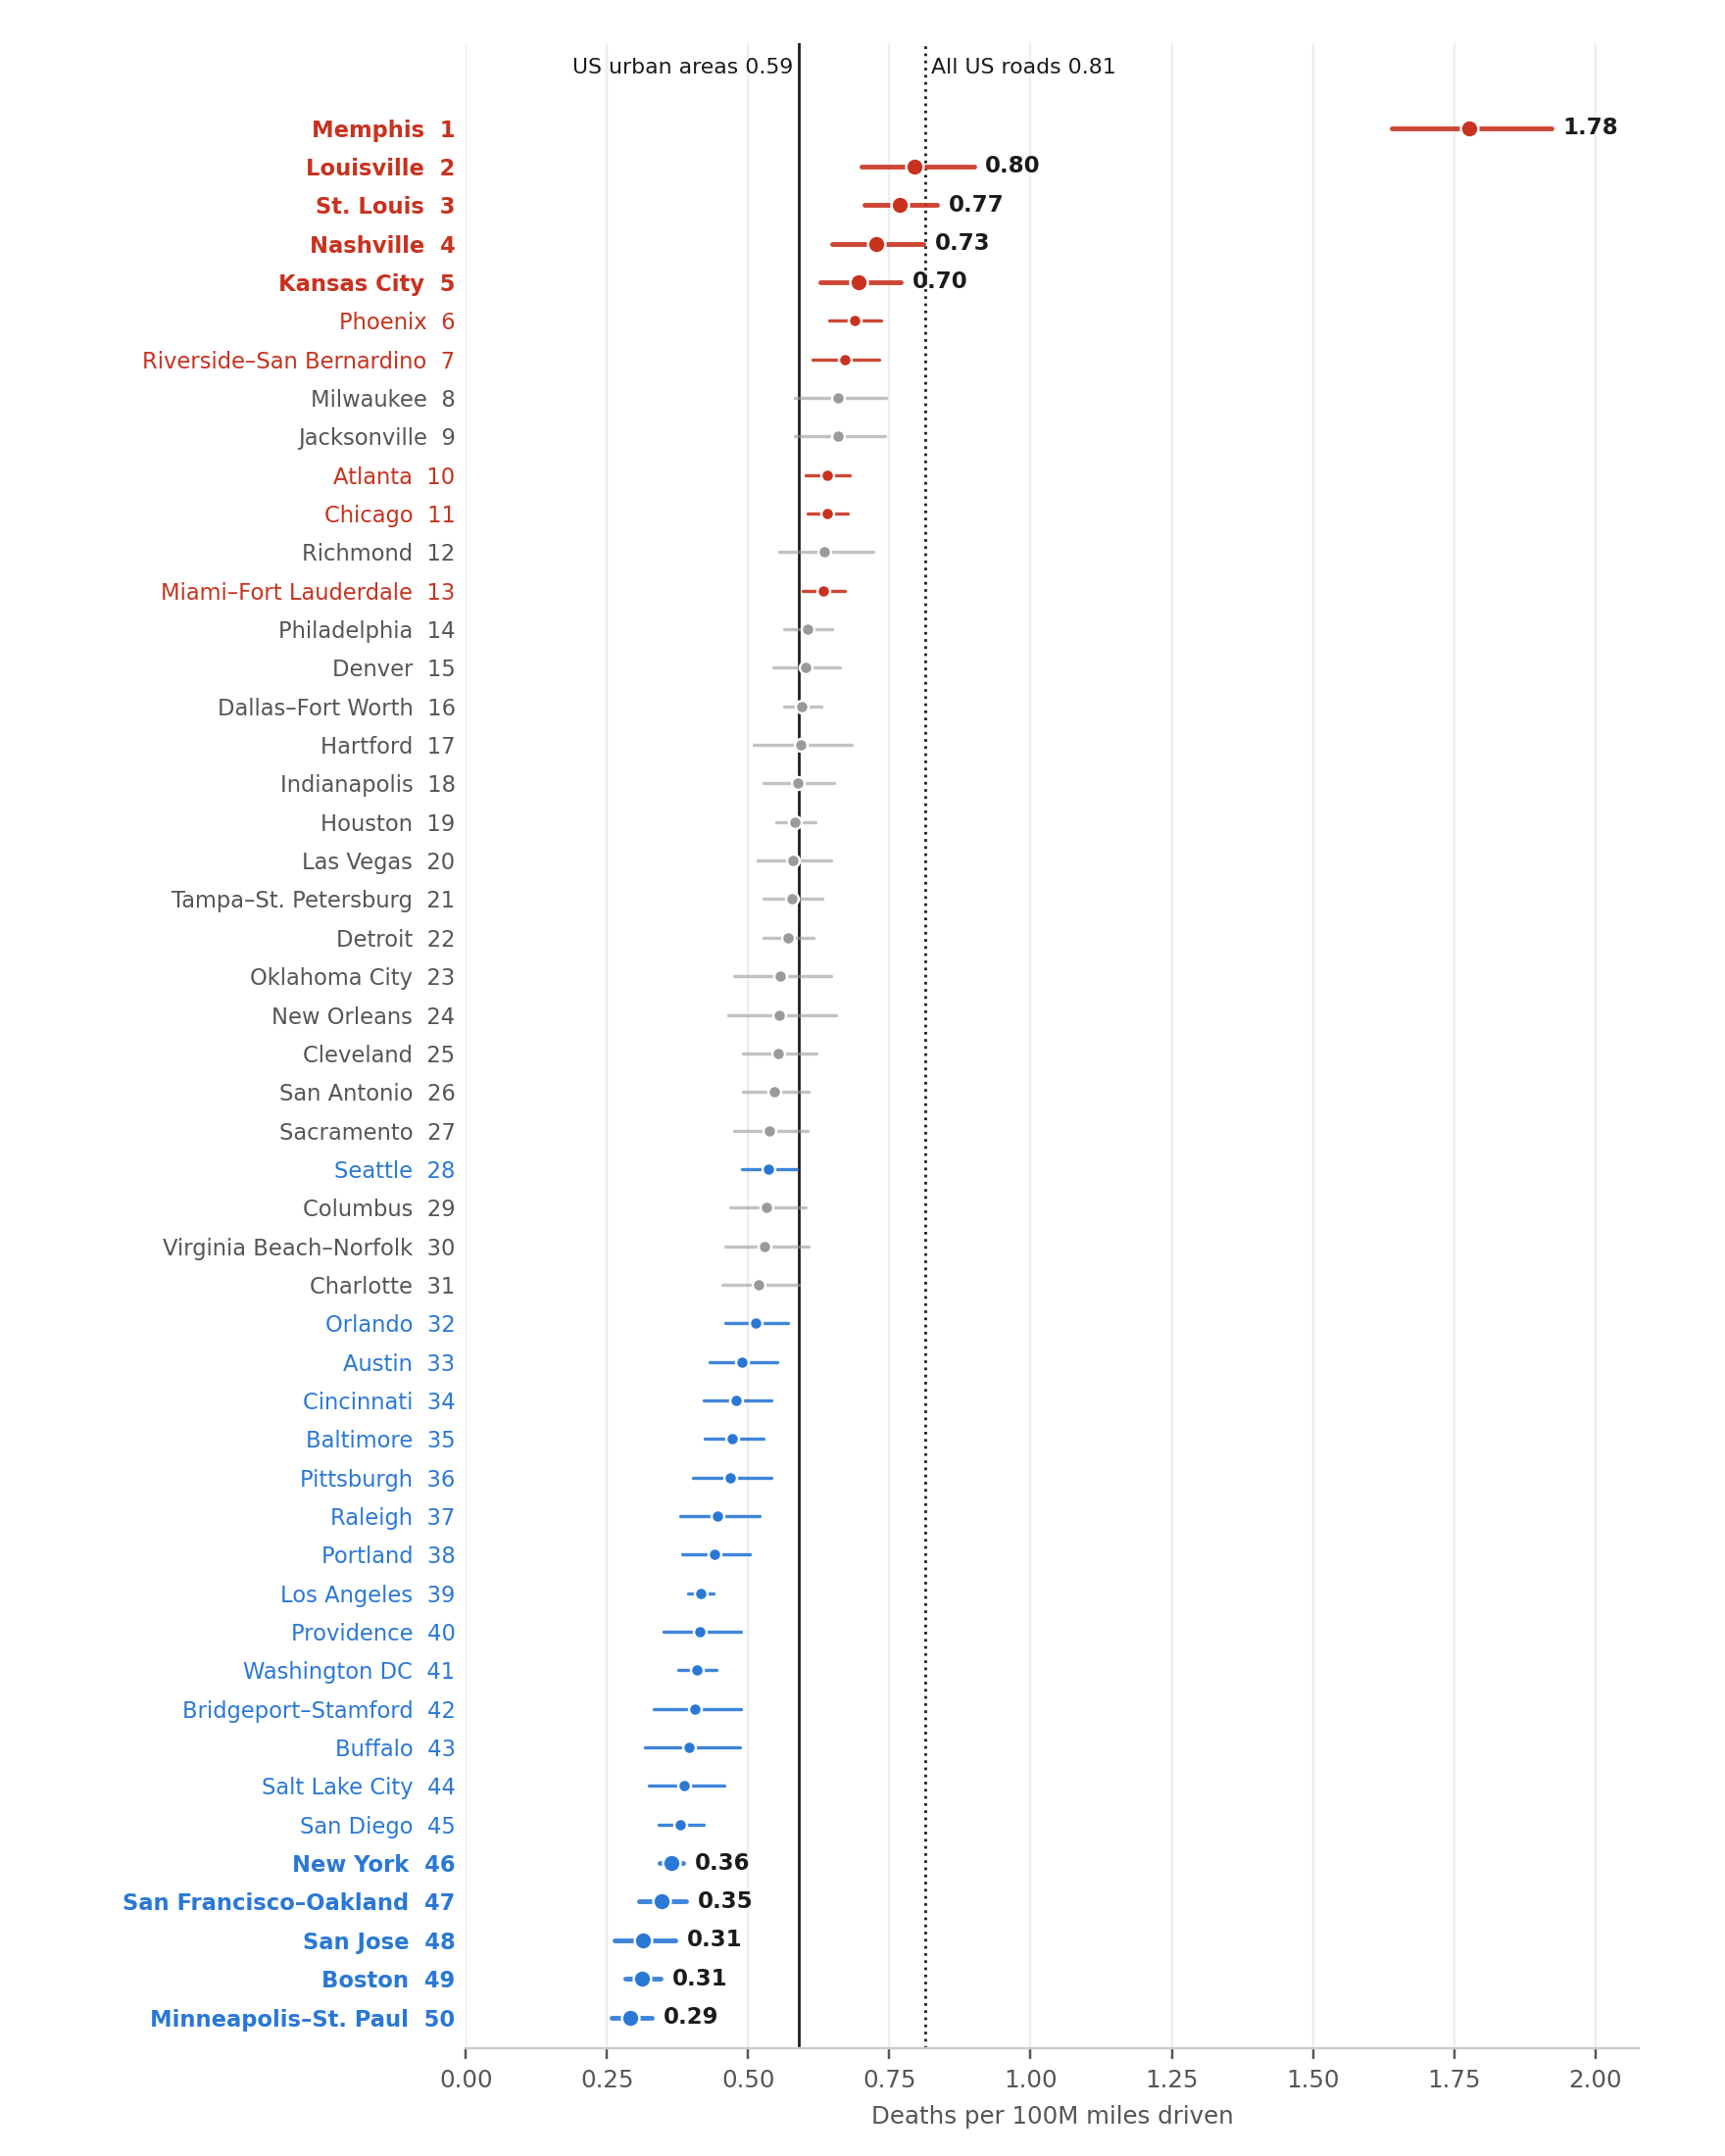
The 5 deadliest
1. Memphis — 1.78
Memphis is three times the urban average and more than twice the next city. Speeding is a major problem in Memphis, with local authorities undertaking a decade-long effort to crack down on speeding. Memphis also has many wide, fast arterial roads that are typically more dangerous than other road types. Recent efforts against reckless driving have led to a measurable reduction in fatalities in 2025.
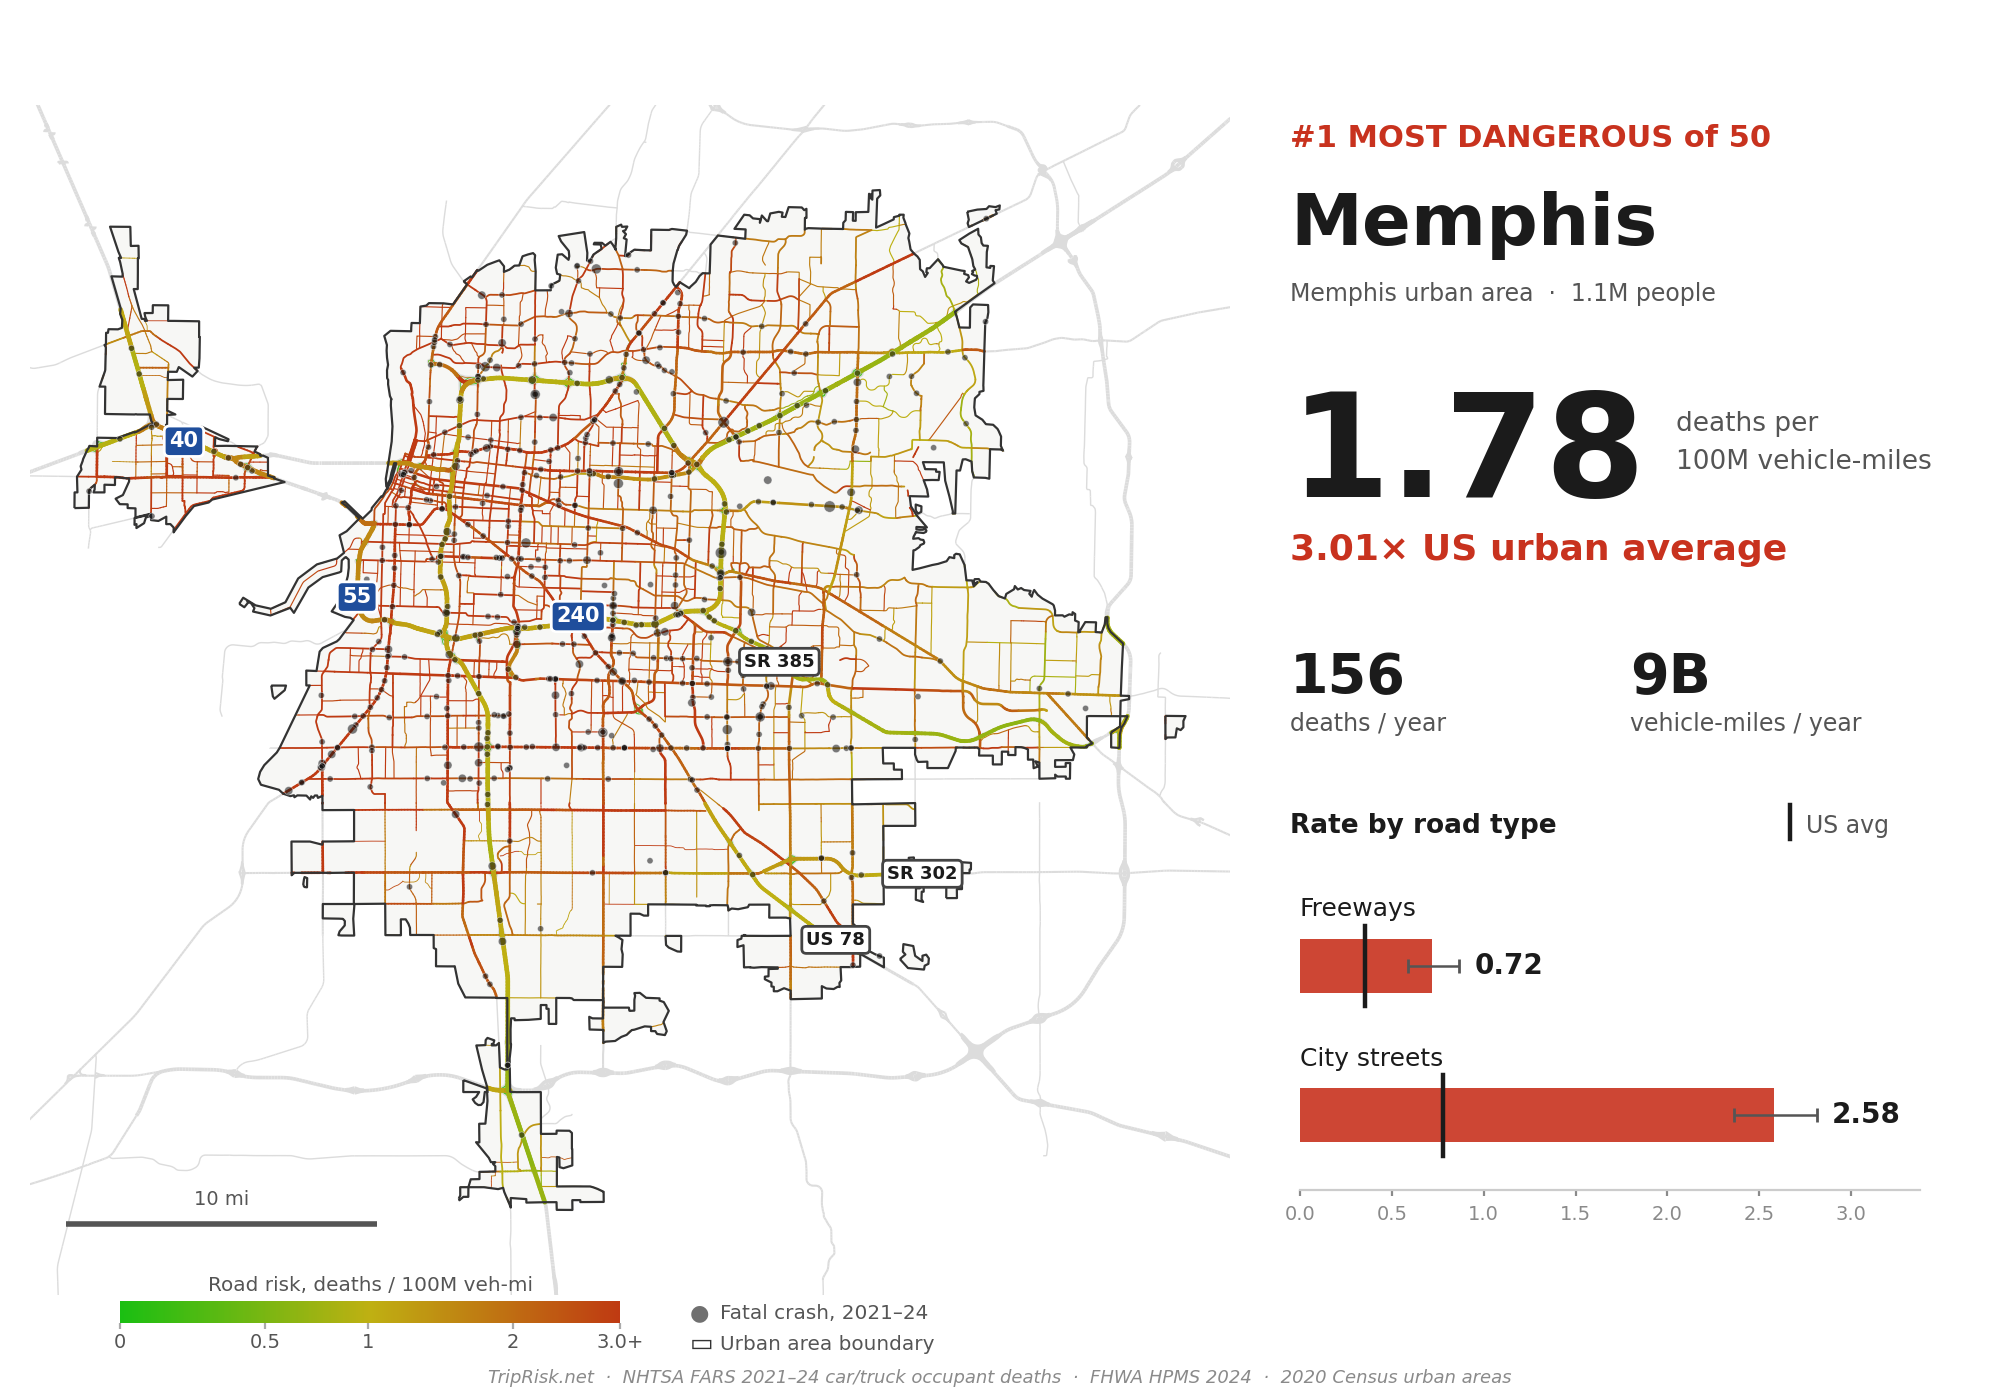
2. Louisville — 0.80
Louisville's city streets are at about 1.5× the urban street average.
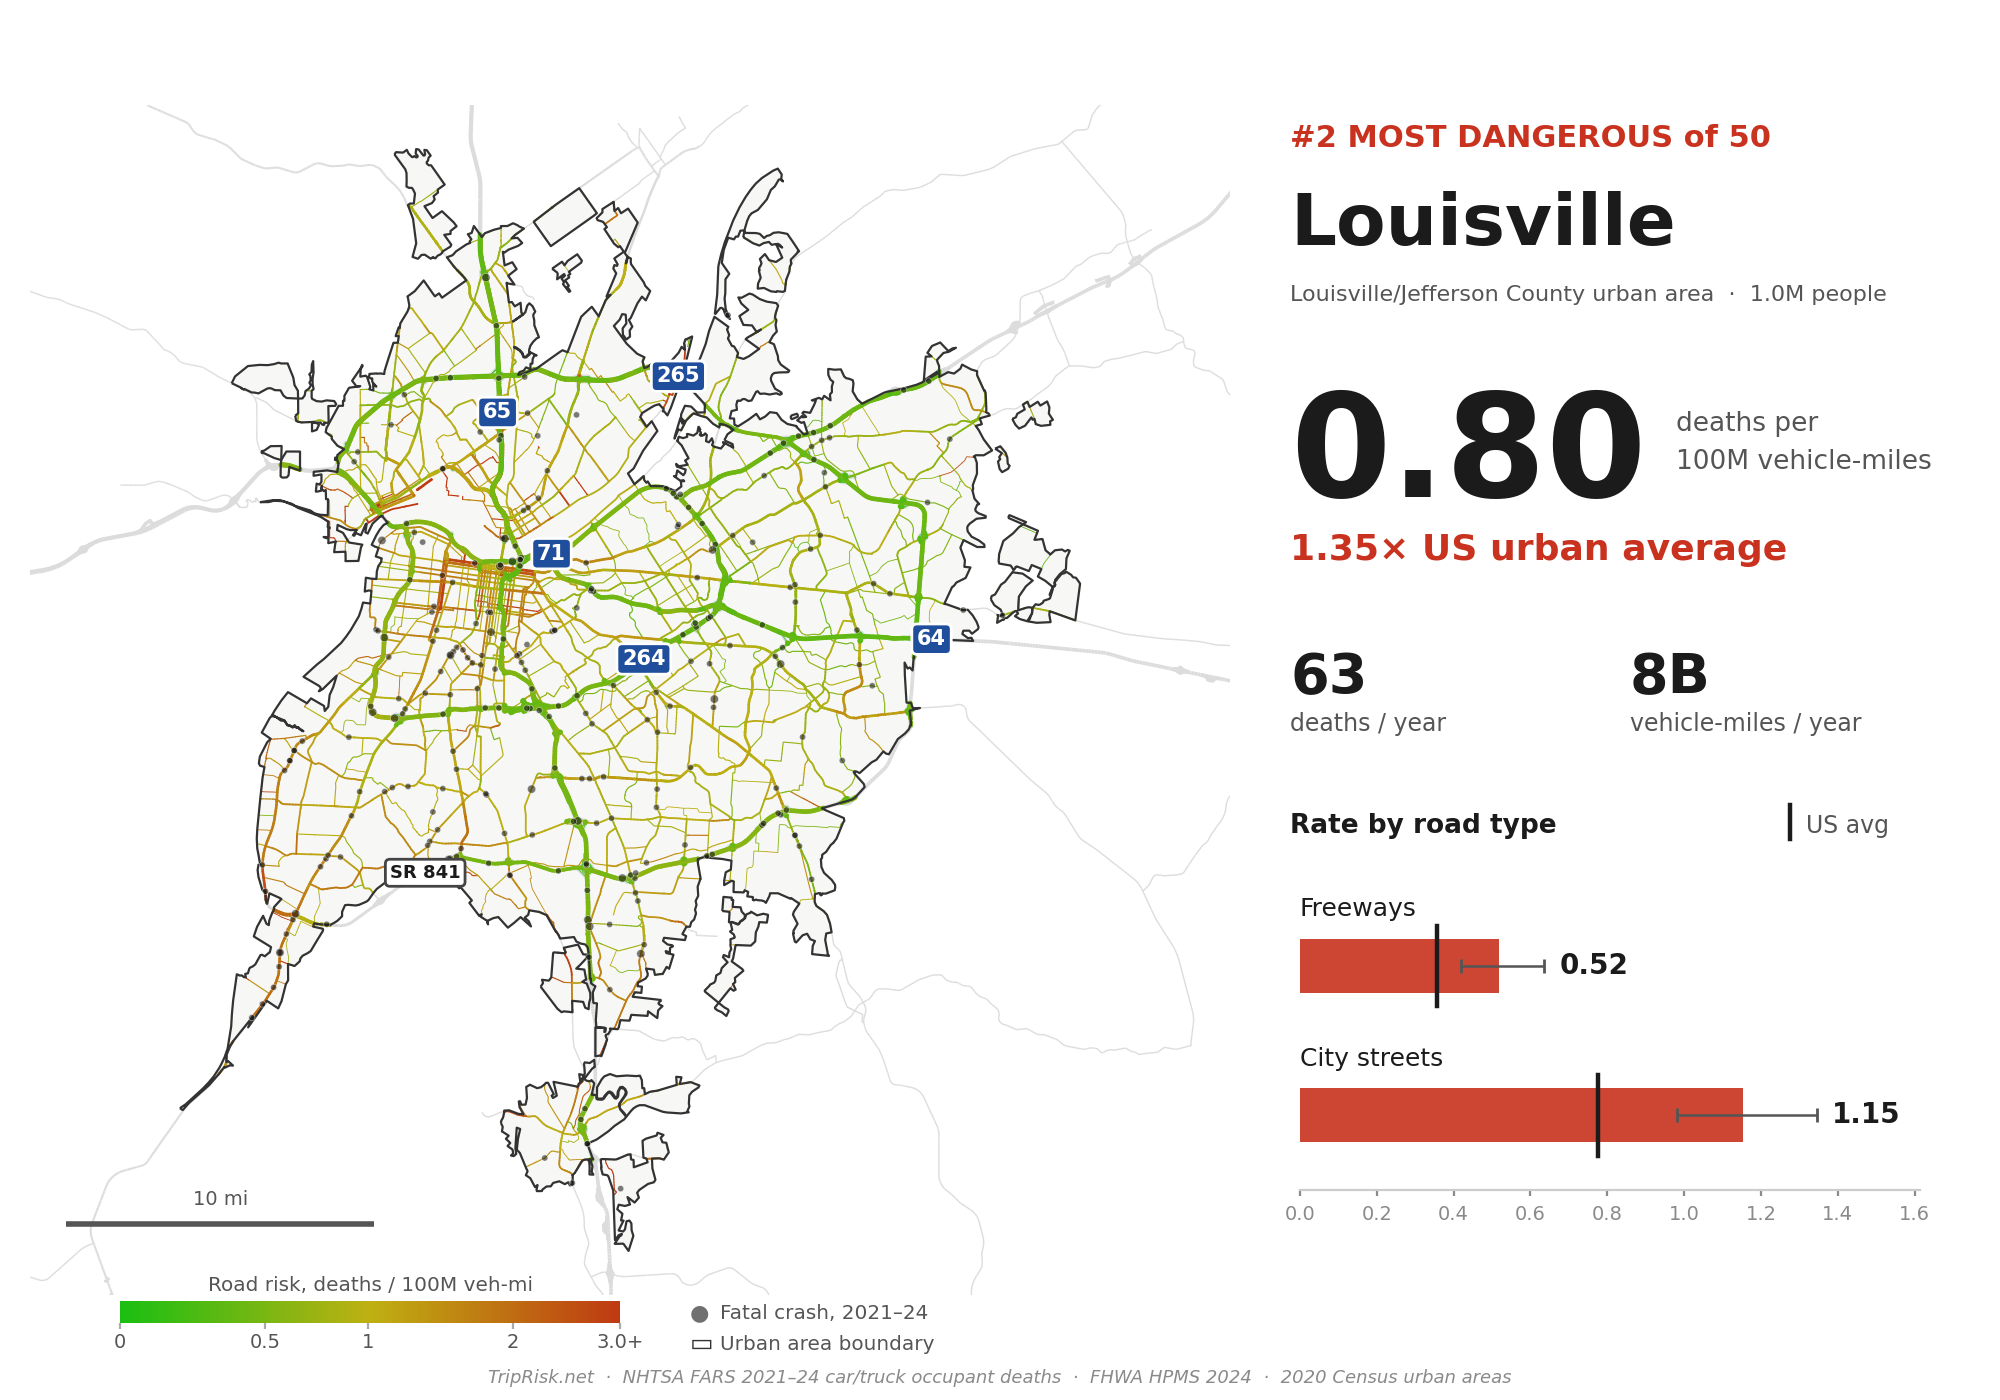
3. St. Louis — 0.77
Safe-ish freeways (0.45), but the streets are among the highest outside Memphis.
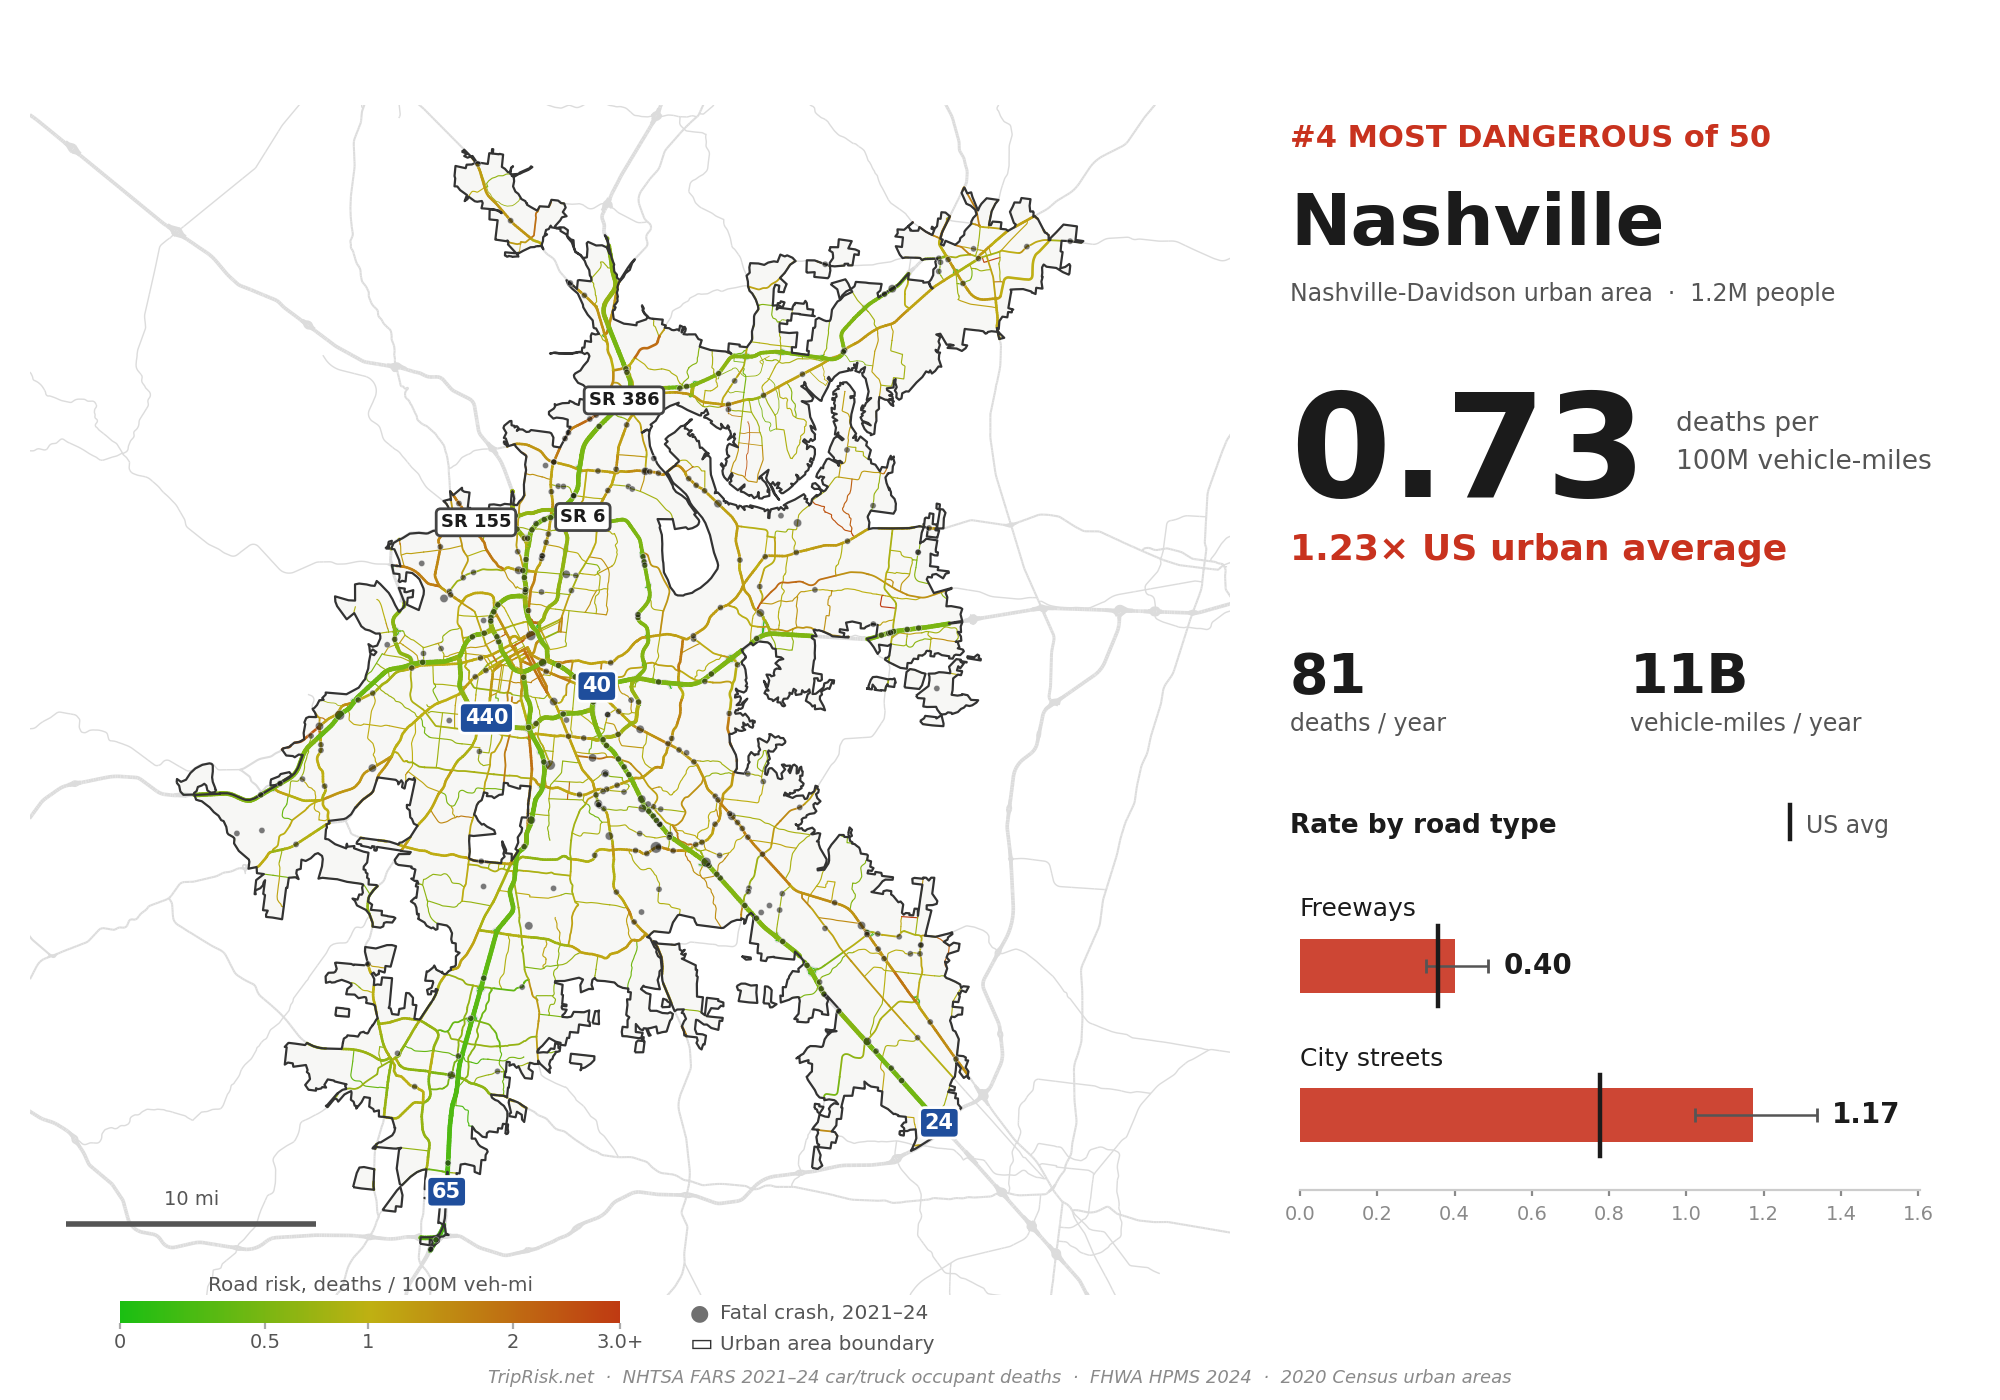
4. Nashville — 0.73
The fastest rising fatality rate: 27th before the pandemic, 4th now.
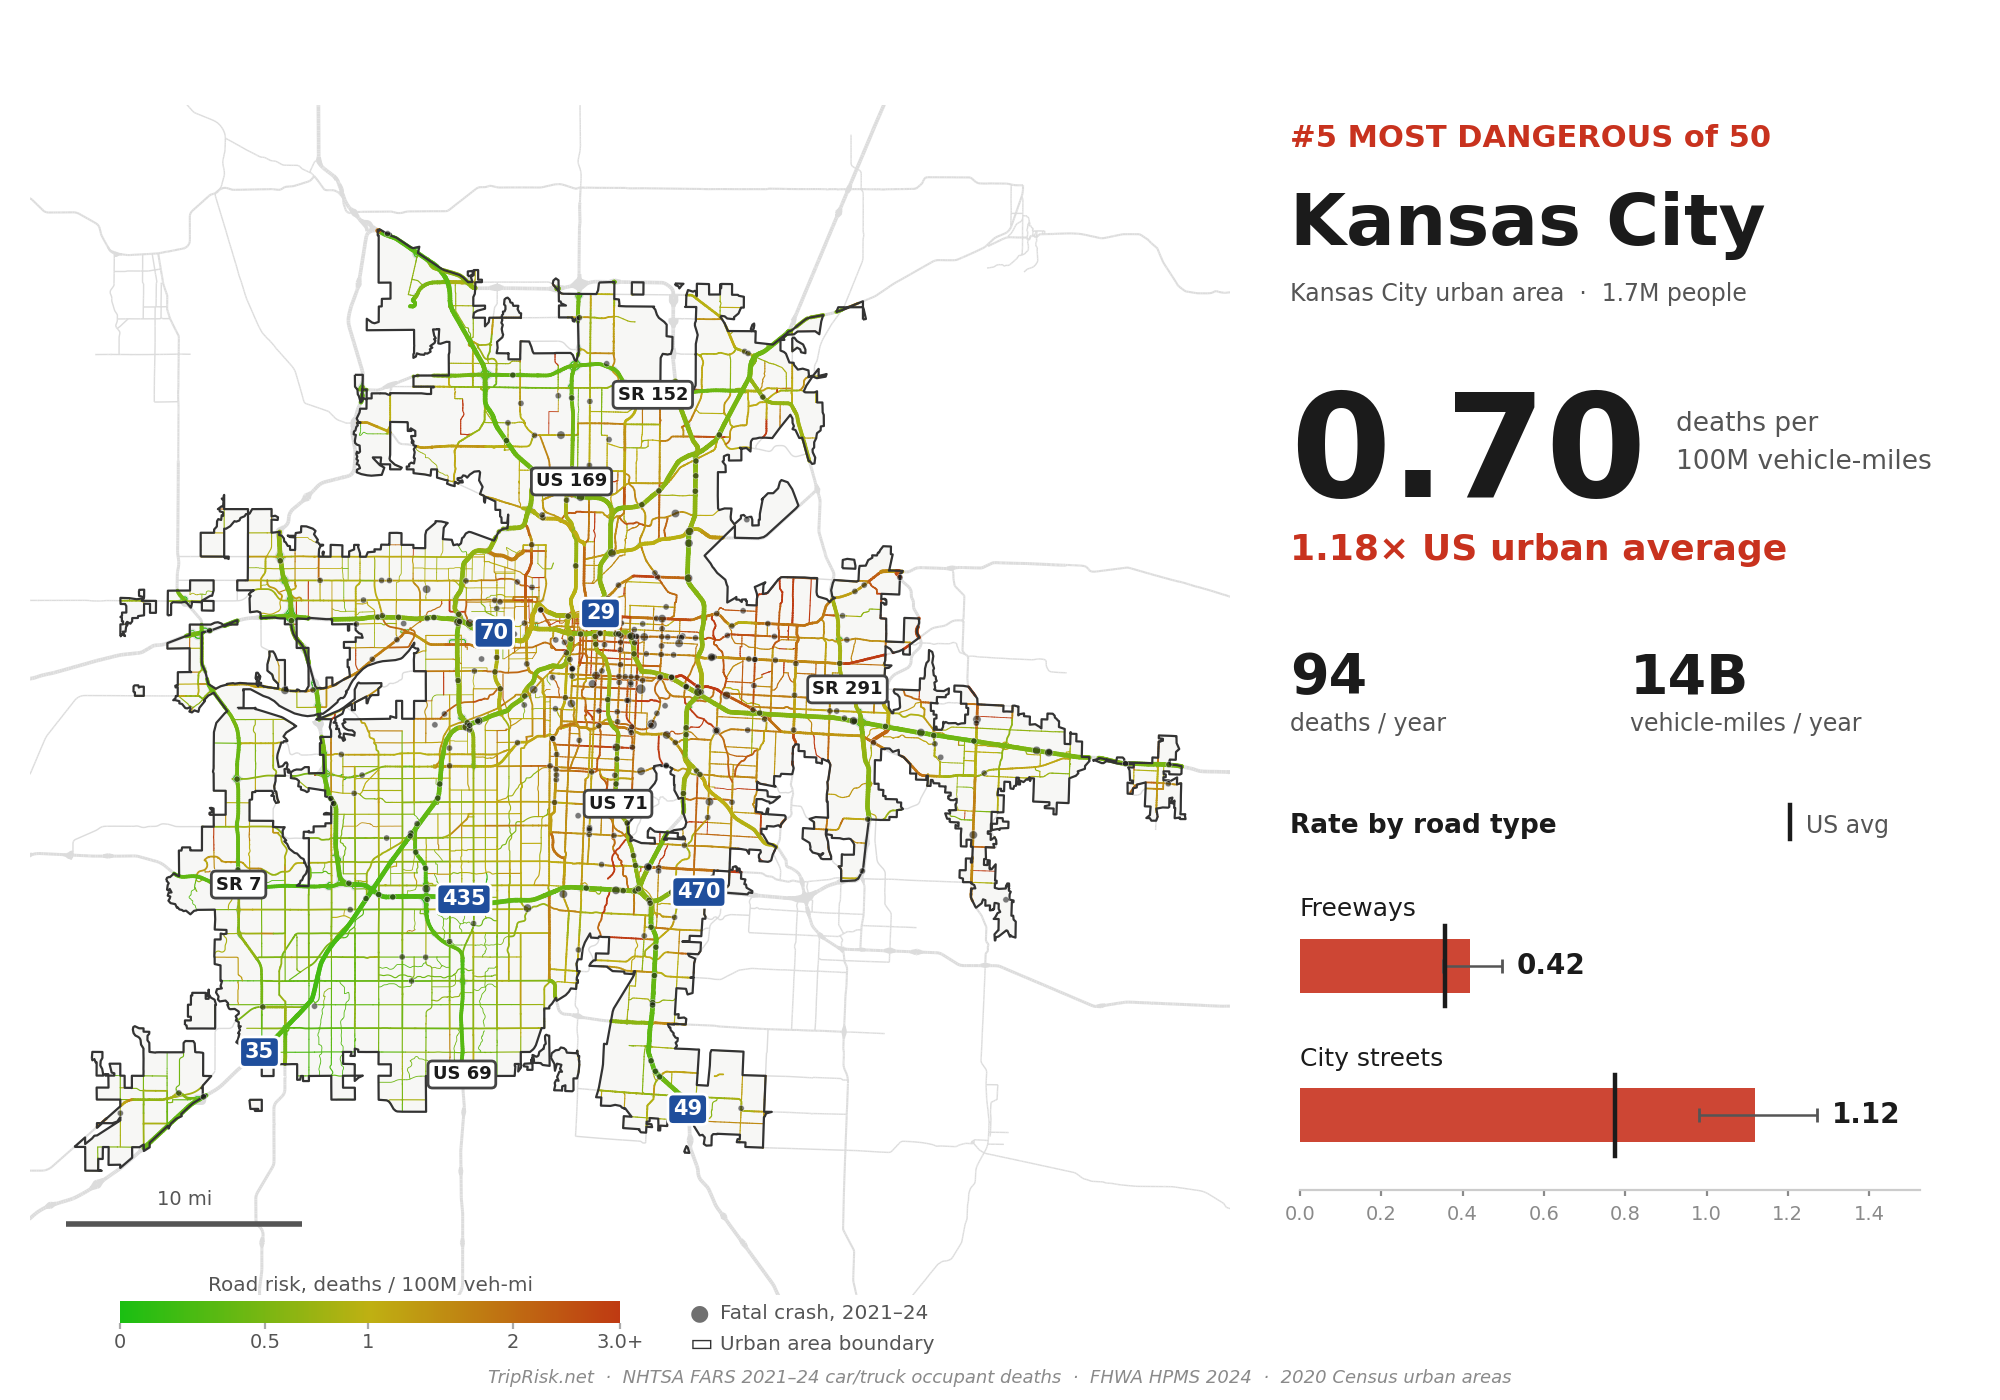
5. Kansas City — 0.70
The 5 safest
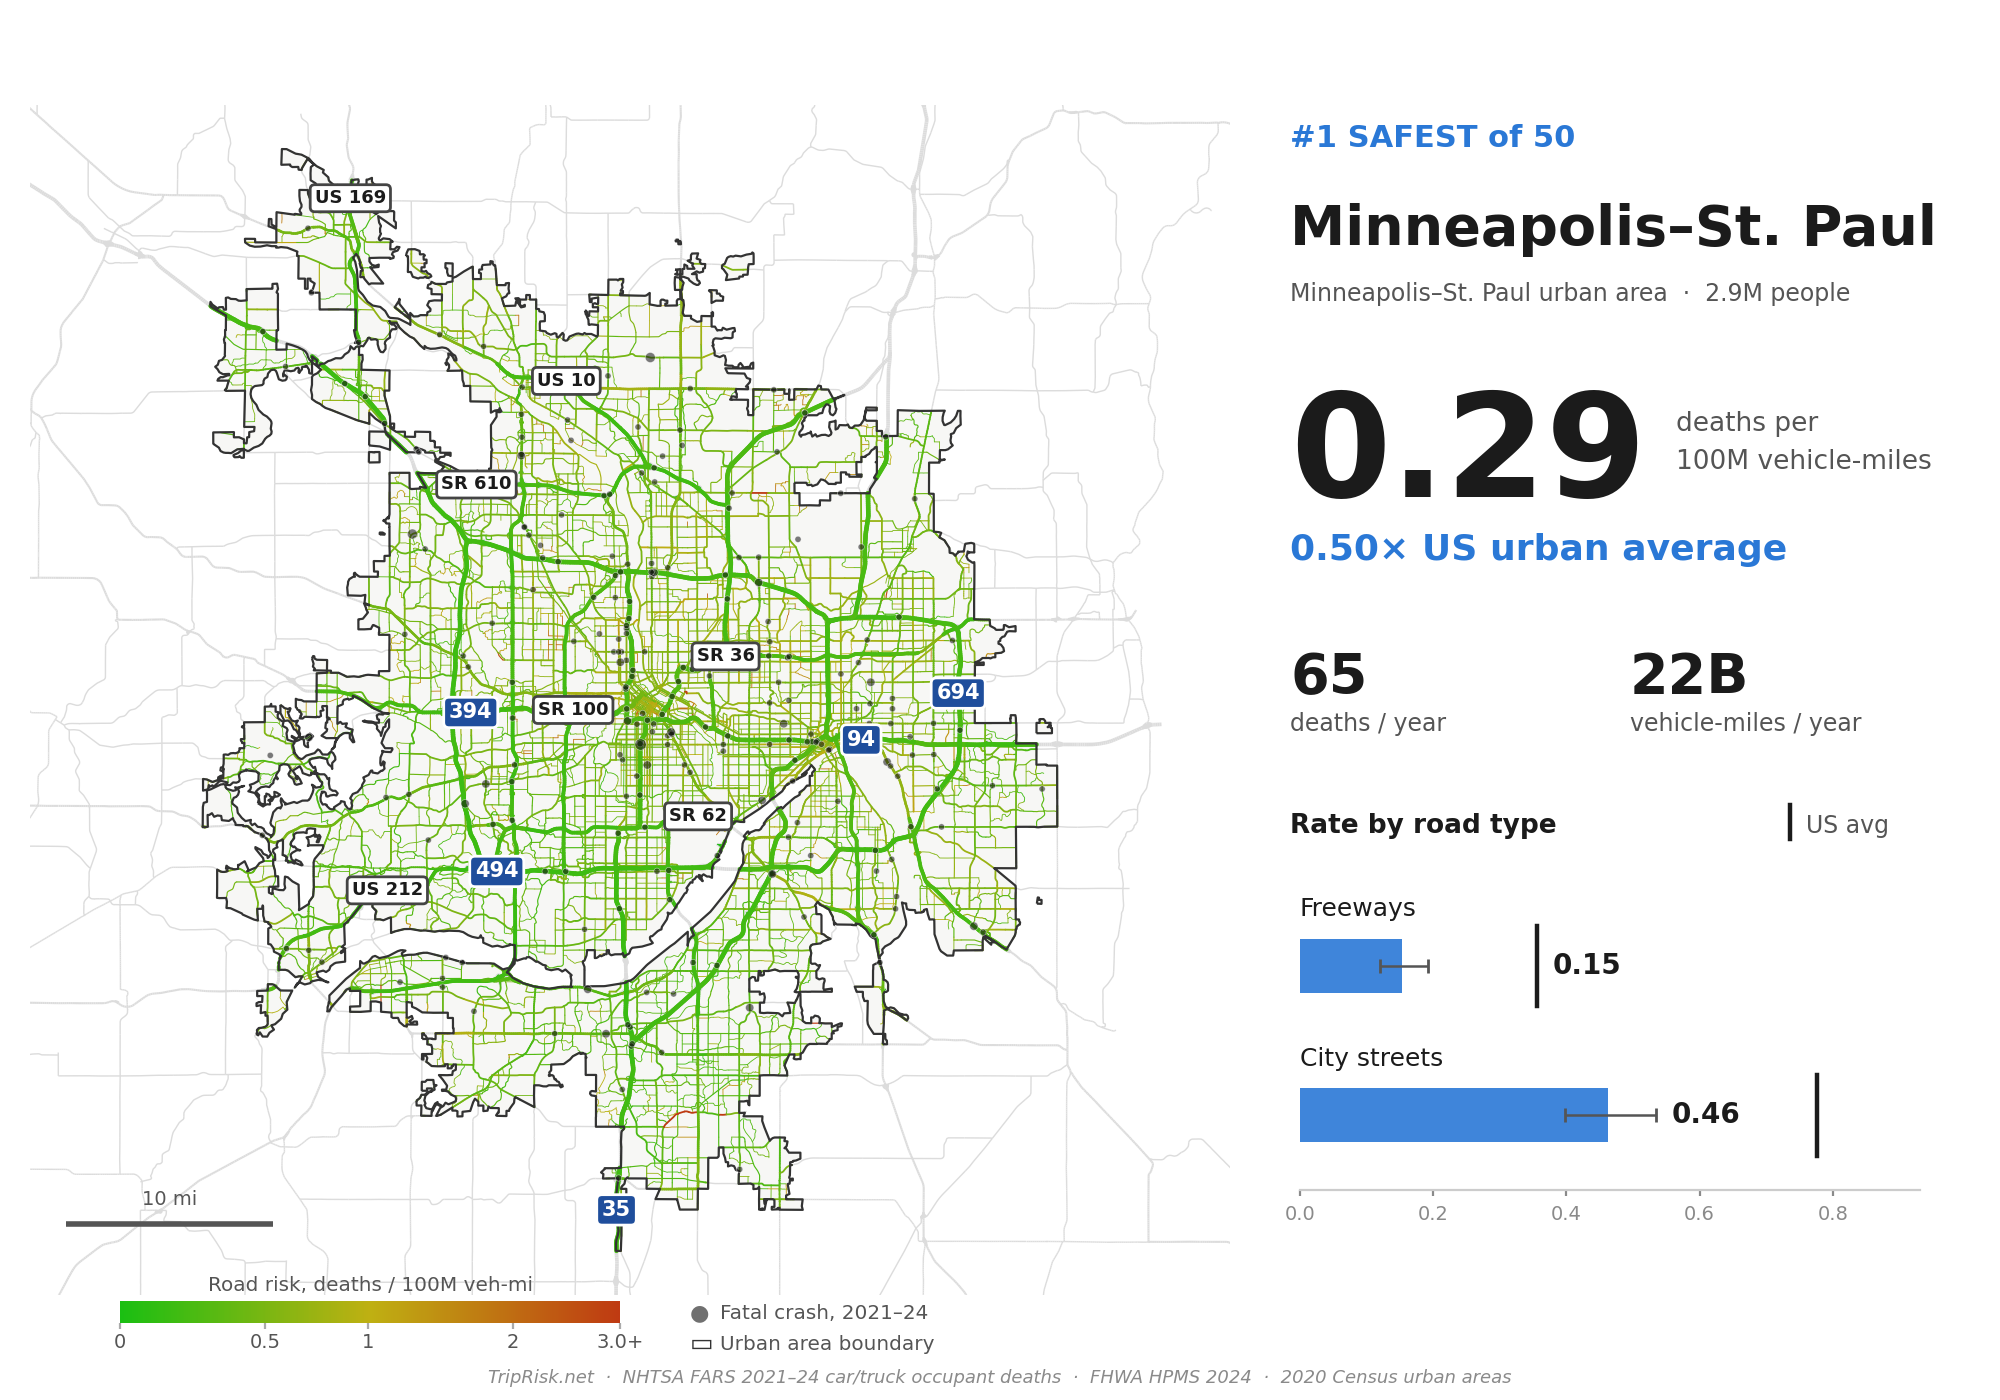
50. Minneapolis–St. Paul — 0.29
The safest big city to drive in.
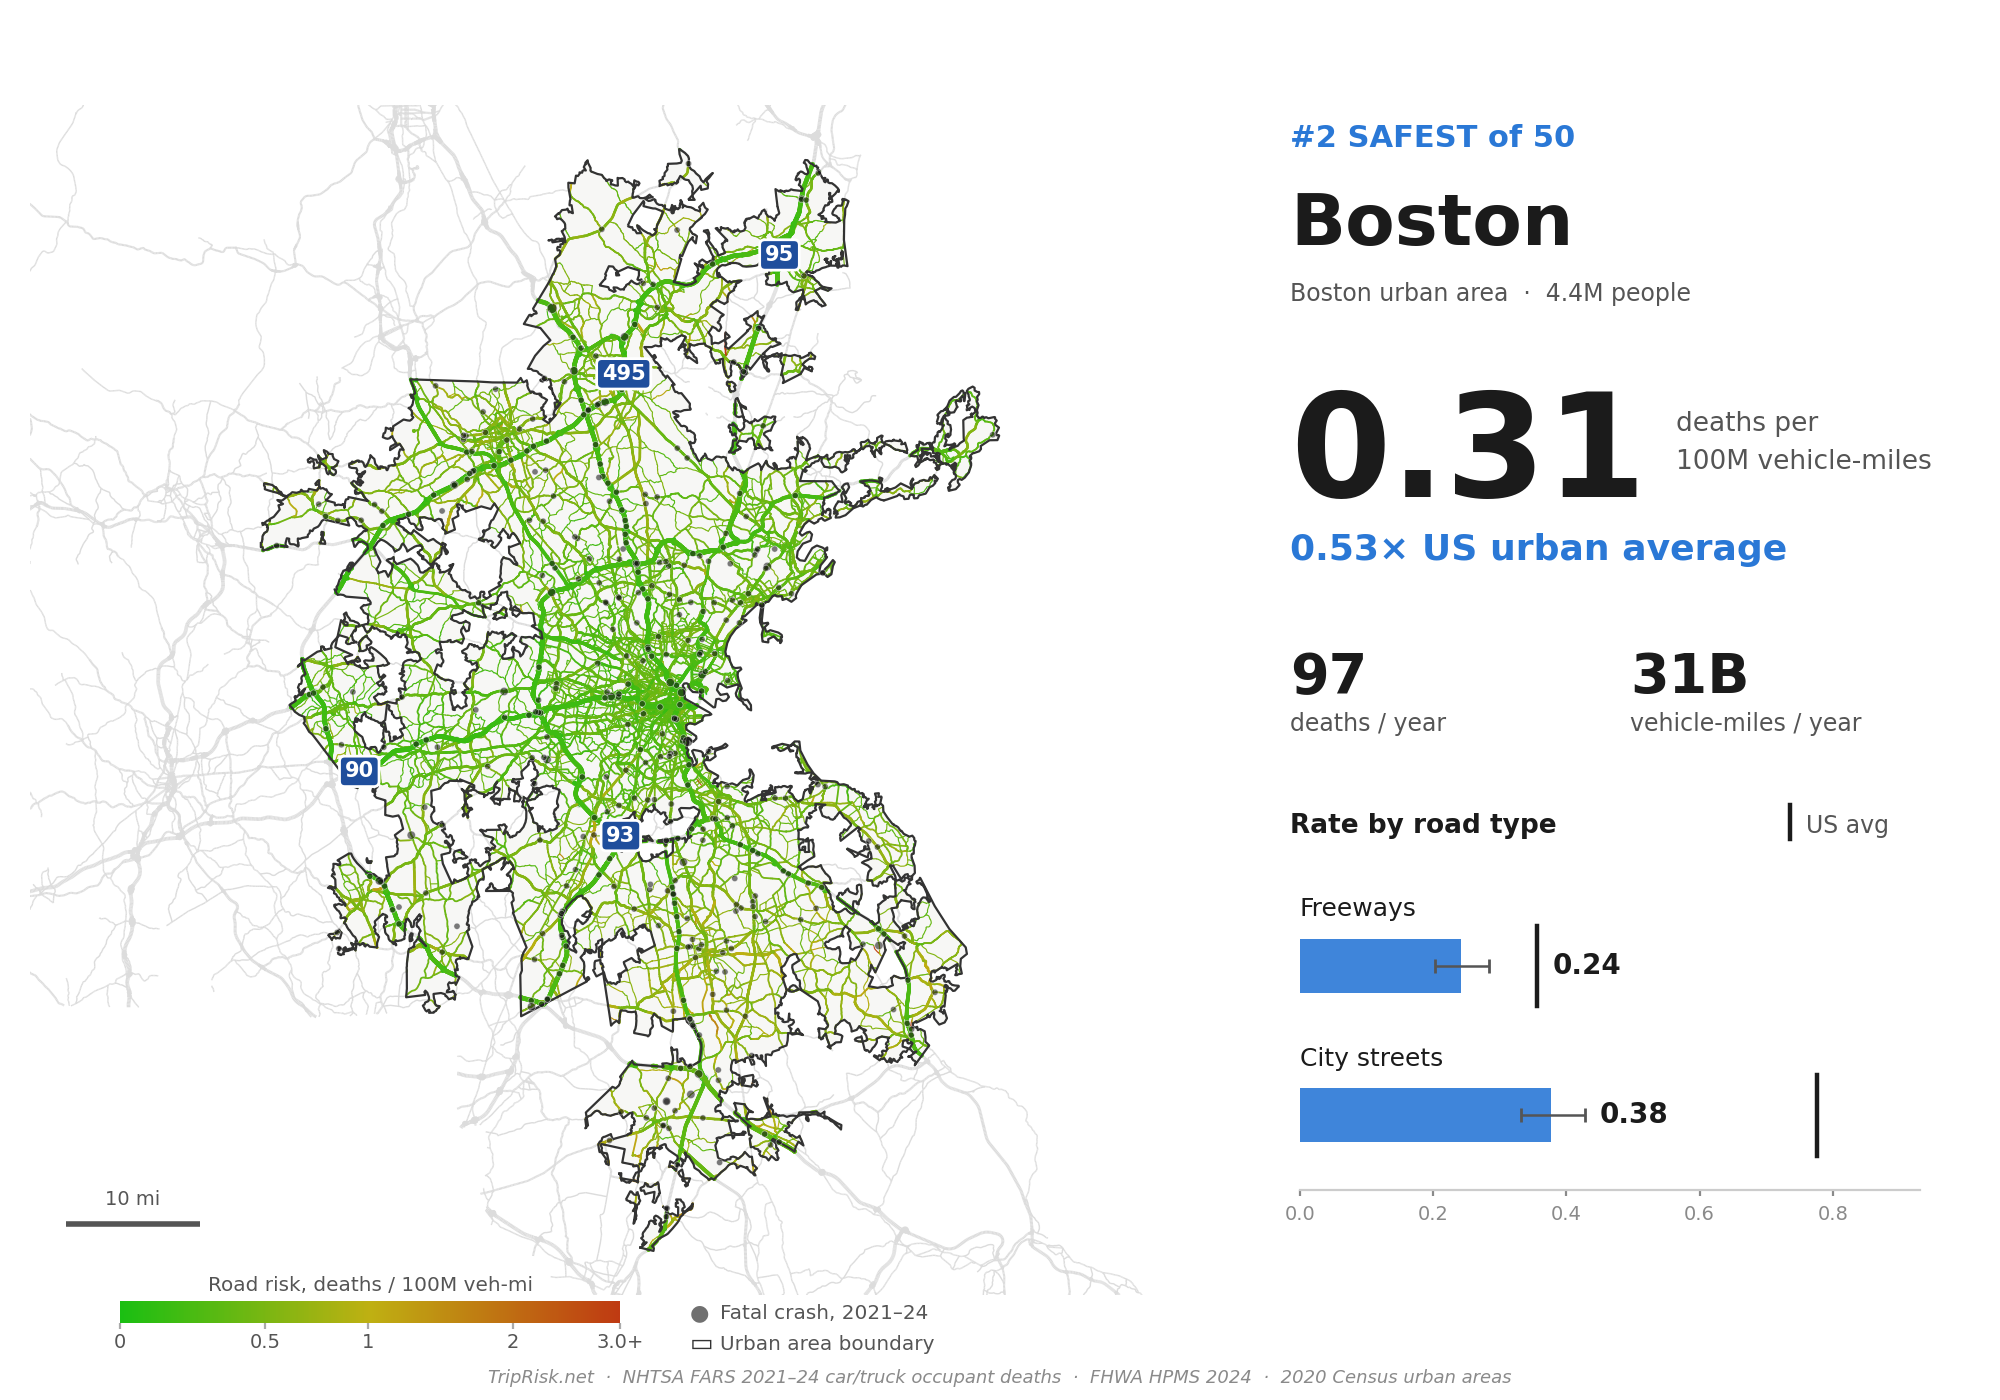
49. Boston — 0.31
Low on both freeways (0.24) and streets (0.38).
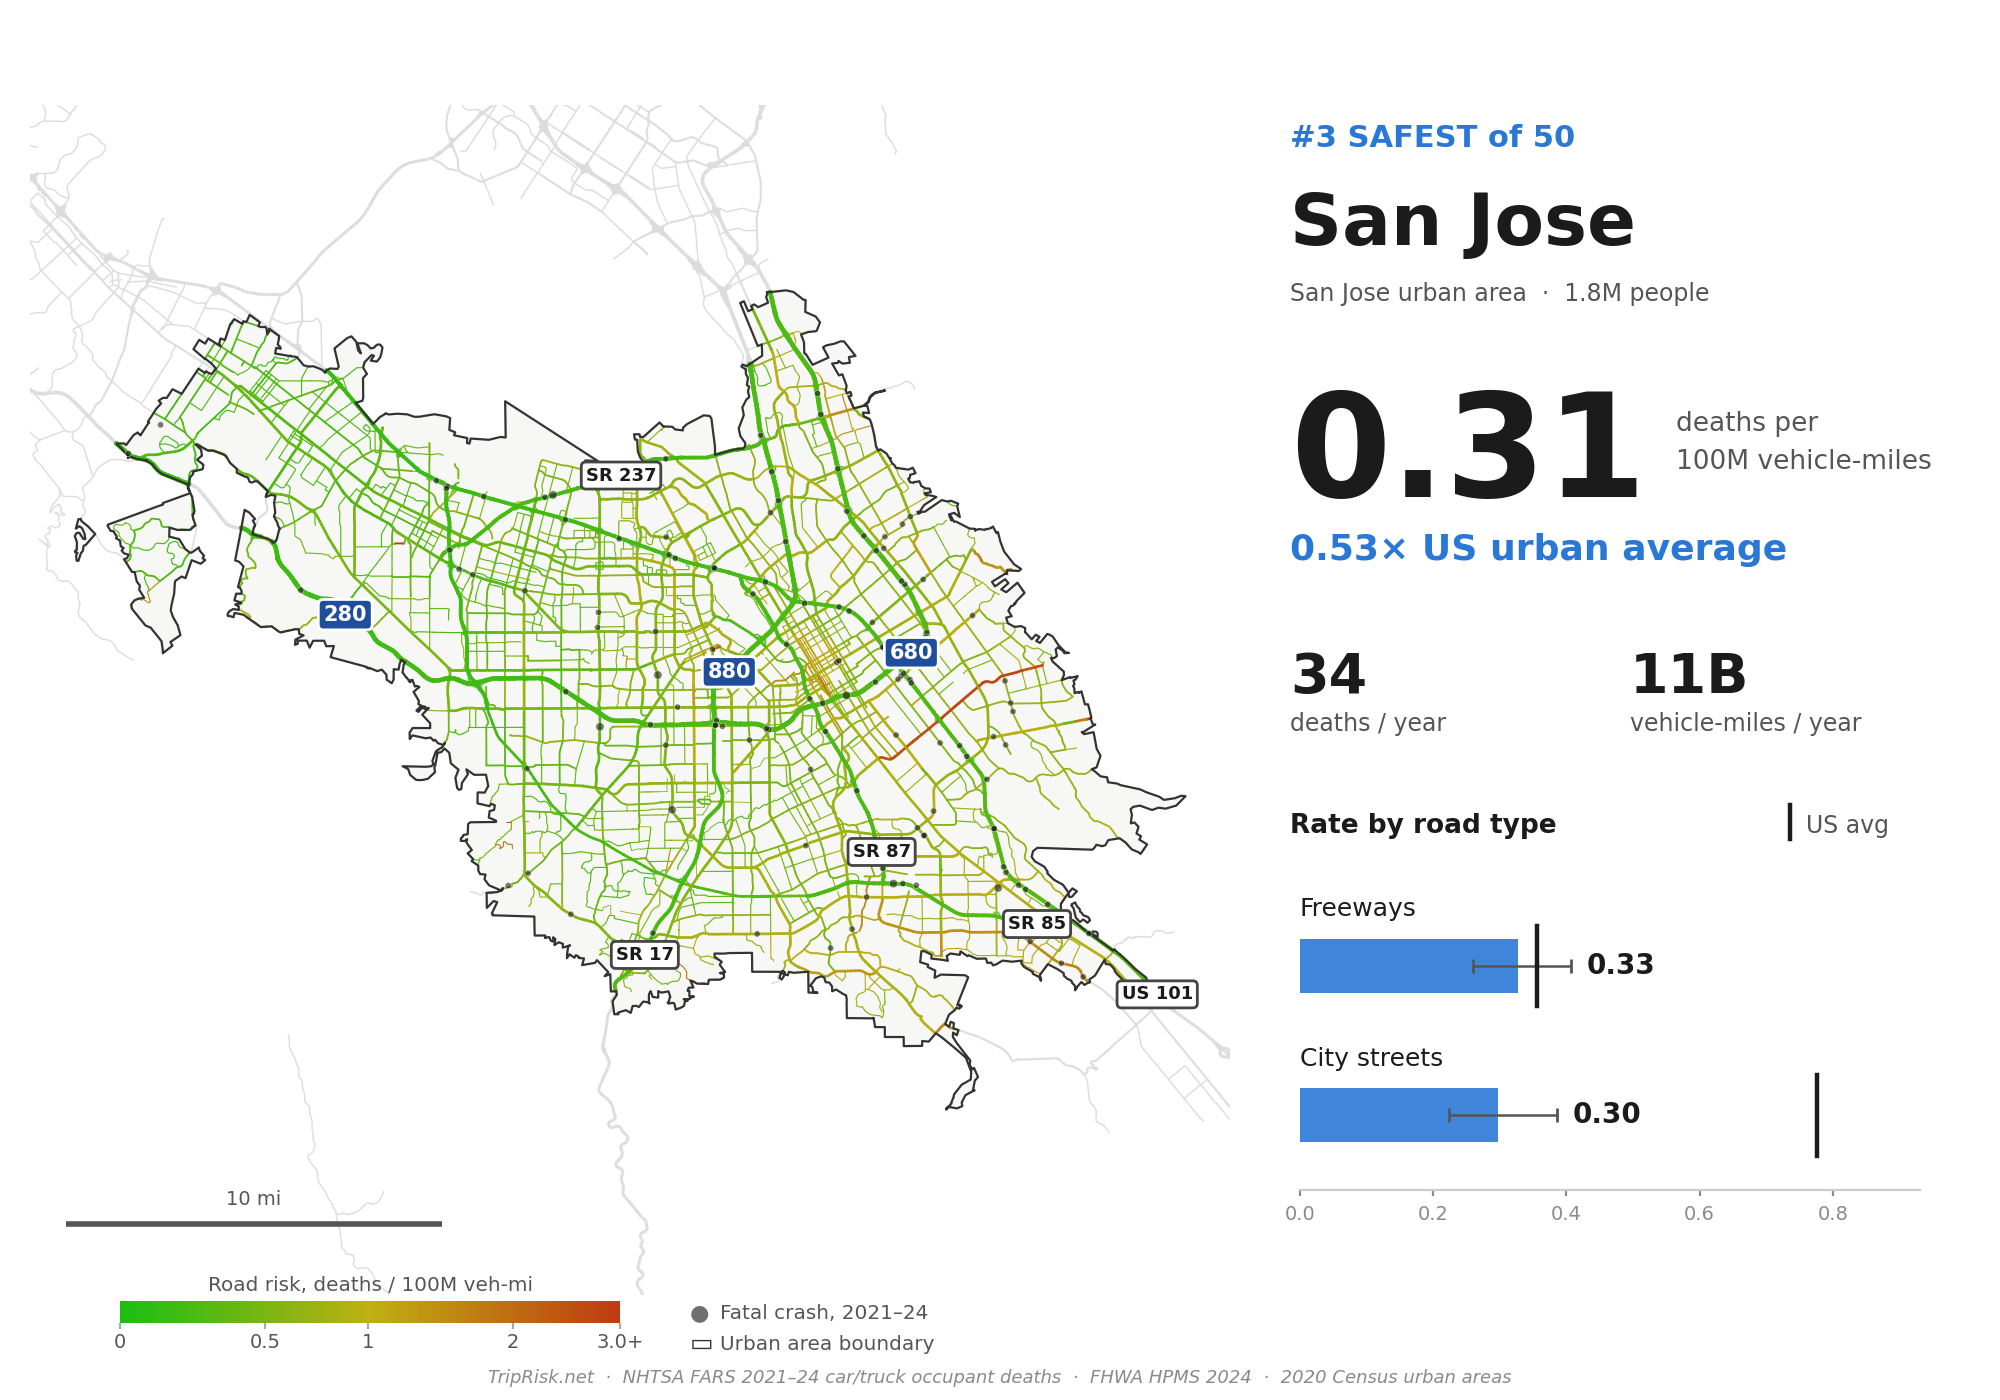
48. San Jose — 0.31
The only big city where city streets are no deadlier than its freeways.
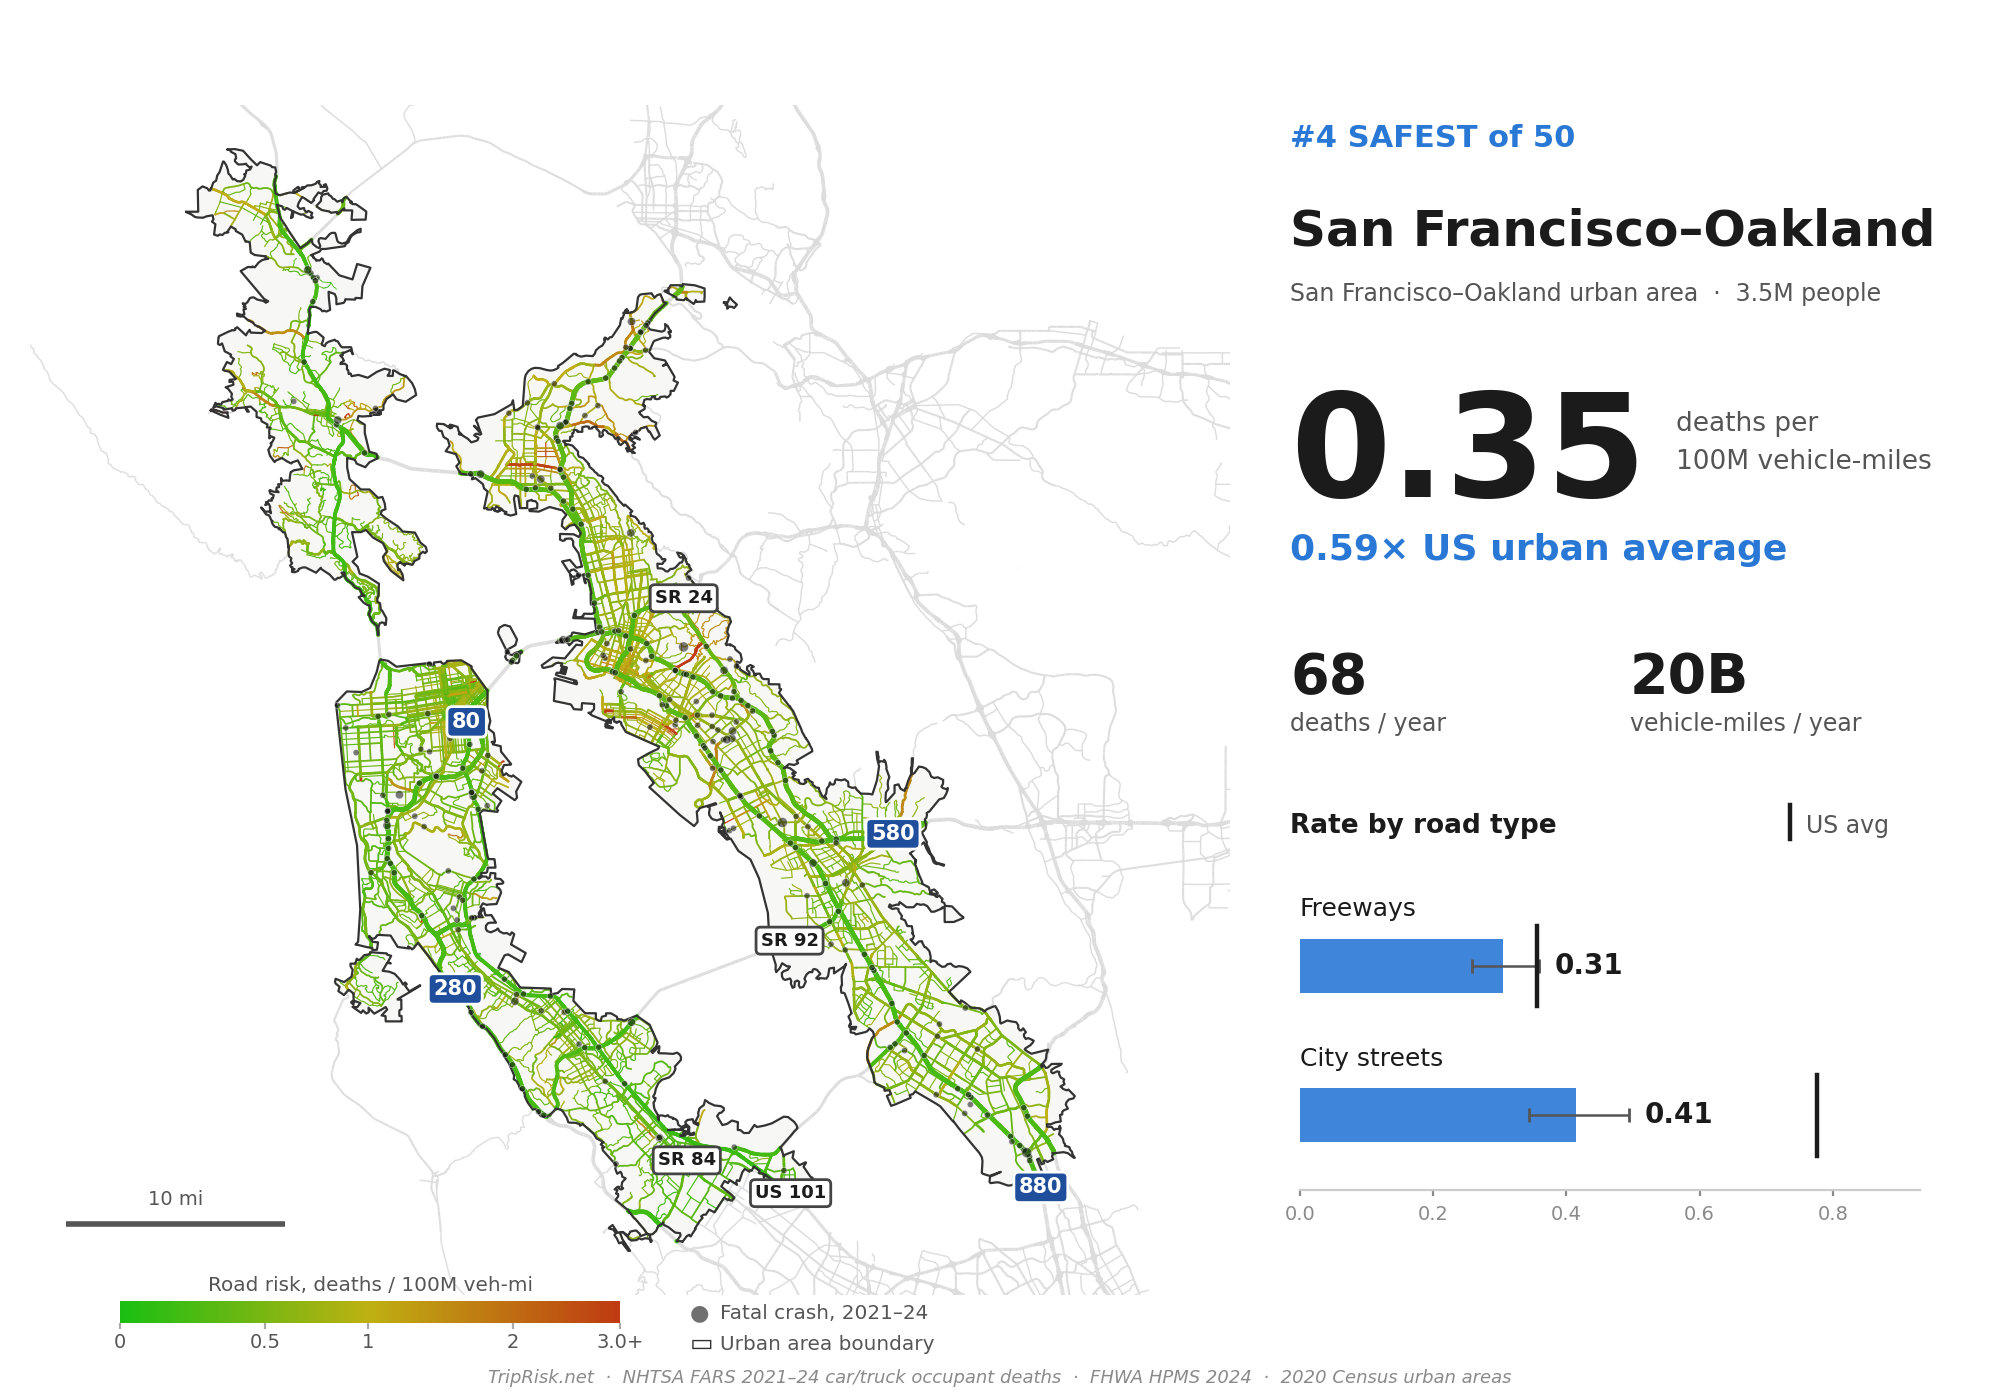
47. San Francisco–Oakland — 0.35
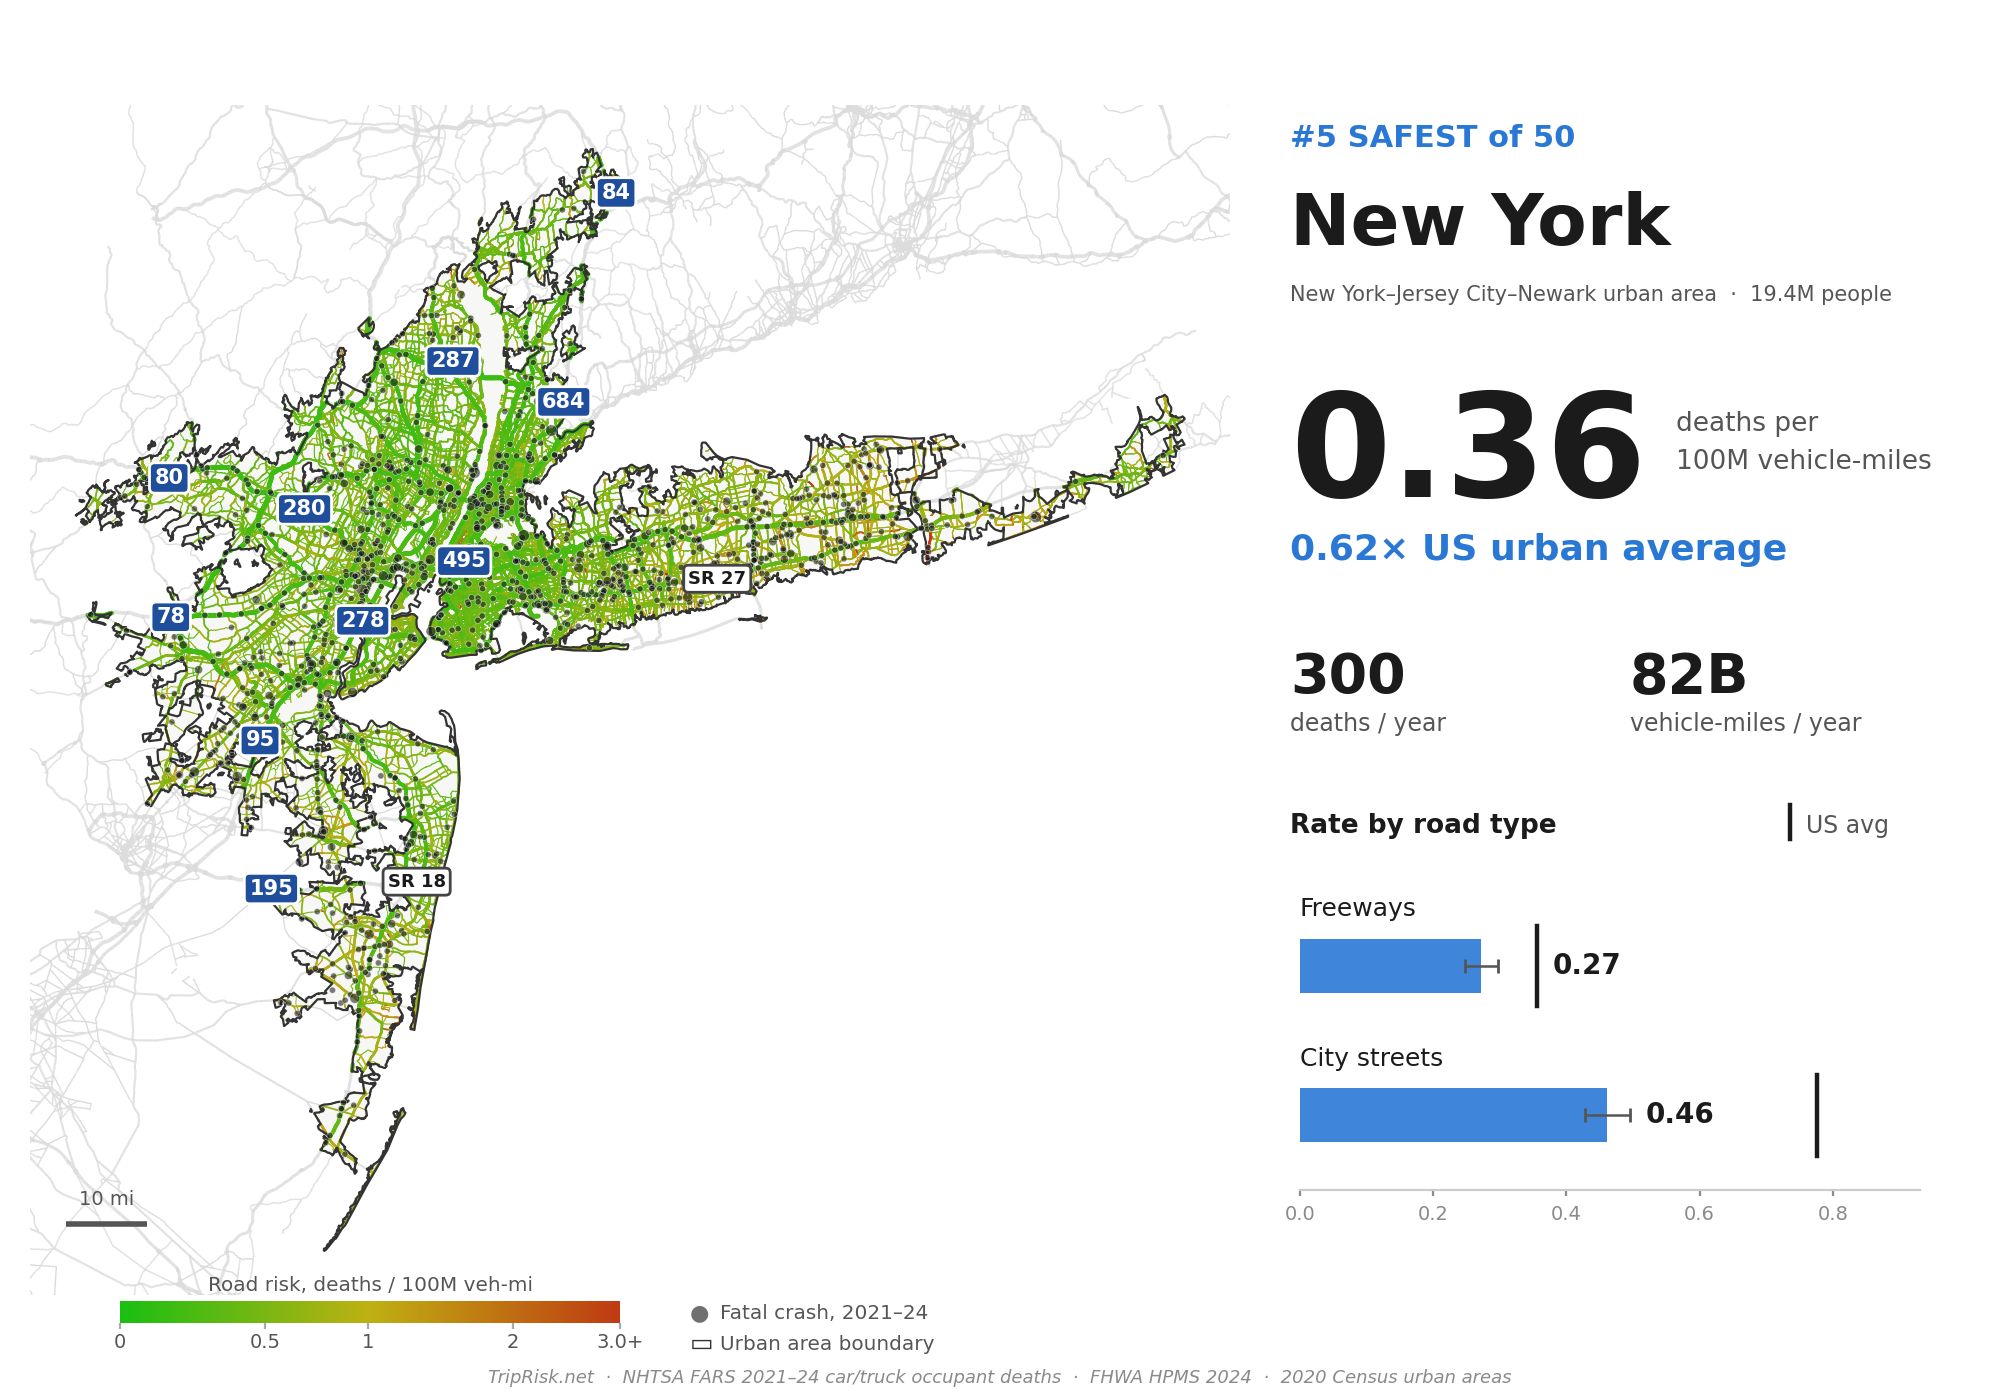
46. New York — 0.36
Despite 300 occupant deaths a year, New York's huge volume of driving makes it among the safest in the country.
Full ranking
| Rank | City | Overall | Freeways | City streets | Deaths/yr |
|---|---|---|---|---|---|
| 1 | Memphis | 1.78 | 0.72 | 2.58 | 156 |
| 2 | Louisville | 0.80 | 0.52 | 1.15 | 63 |
| 3 | St. Louis | 0.77 | 0.45 | 1.23 | 142 |
| 4 | Nashville | 0.73 | 0.40 | 1.17 | 81 |
| 5 | Kansas City | 0.70 | 0.42 | 1.12 | 94 |
| 6 | Phoenix | 0.69 | 0.31 | 0.97 | 216 |
| 7 | Riverside–San Bernardino | 0.67 | 0.41 | 1.11 | 128 |
| 8 | Milwaukee | 0.66 | 0.19 | 0.99 | 66 |
| 9 | Jacksonville | 0.66 | 0.41 | 0.93 | 68 |
| 10 | Atlanta | 0.64 | 0.44 | 0.85 | 264 |
| 11 | Chicago | 0.64 | 0.40 | 0.81 | 320 |
| 12 | Richmond | 0.63 | 0.57 | 0.71 | 58 |
| 13 | Miami–Fort Lauderdale | 0.63 | 0.37 | 0.83 | 288 |
| 14 | Philadelphia | 0.60 | 0.38 | 0.77 | 191 |
| 15 | Denver | 0.60 | 0.35 | 0.85 | 104 |
| 16 | Dallas–Fort Worth | 0.60 | 0.46 | 0.78 | 314 |
| 17 | Hartford | 0.59 | 0.52 | 0.68 | 47 |
| 18 | Indianapolis | 0.59 | 0.30 | 0.82 | 87 |
| 19 | Houston | 0.58 | 0.32 | 0.88 | 280 |
| 20 | Las Vegas | 0.58 | 0.22 | 0.83 | 77 |
| 21 | Tampa–St. Petersburg | 0.58 | 0.39 | 0.66 | 123 |
| 22 | Detroit | 0.57 | 0.37 | 0.72 | 160 |
| 23 | Oklahoma City | 0.56 | 0.39 | 0.76 | 42 |
| 24 | New Orleans | 0.55 | 0.51 | 0.59 | 34 |
| 25 | Cleveland | 0.55 | 0.38 | 0.77 | 72 |
| 26 | San Antonio | 0.55 | 0.35 | 0.81 | 87 |
| 27 | Sacramento | 0.54 | 0.37 | 0.71 | 68 |
| 28 | Seattle | 0.54 | 0.31 | 0.80 | 121 |
| 29 | Columbus | 0.53 | 0.32 | 0.79 | 63 |
| 30 | Virginia Beach–Norfolk | 0.53 | 0.31 | 0.72 | 51 |
| 31 | Charlotte | 0.52 | 0.41 | 0.62 | 59 |
| 32 | Orlando | 0.51 | 0.31 | 0.66 | 84 |
| 33 | Austin | 0.49 | 0.32 | 0.63 | 66 |
| 34 | Cincinnati | 0.48 | 0.24 | 0.75 | 62 |
| 35 | Baltimore | 0.47 | 0.28 | 0.74 | 81 |
| 36 | Pittsburgh | 0.47 | 0.28 | 0.58 | 45 |
| 37 | Raleigh | 0.45 | 0.26 | 0.60 | 40 |
| 38 | Portland | 0.44 | 0.20 | 0.64 | 55 |
| 39 | Los Angeles | 0.42 | 0.31 | 0.52 | 349 |
| 40 | Providence | 0.41 | 0.30 | 0.55 | 36 |
| 41 | Washington DC | 0.41 | 0.29 | 0.52 | 140 |
| 42 | Bridgeport–Stamford | 0.41 | 0.33 | 0.53 | 27 |
| 43 | Buffalo | 0.40 | 0.25 | 0.50 | 22 |
| 44 | Salt Lake City | 0.39 | 0.18 | 0.58 | 34 |
| 45 | San Diego | 0.38 | 0.31 | 0.50 | 88 |
| 46 | New York | 0.36 | 0.27 | 0.46 | 300 |
| 47 | San Francisco–Oakland | 0.35 | 0.31 | 0.41 | 68 |
| 48 | San Jose | 0.31 | 0.33 | 0.30 | 34 |
| 49 | Boston | 0.31 | 0.24 | 0.38 | 97 |
| 50 | Minneapolis–St. Paul | 0.29 | 0.15 | 0.46 | 65 |
Rates are occupant deaths per 100 million vehicle-miles. Sources: NHTSA FARS 2021–2024, FHWA HPMS 2024, US Census 2020 urban areas.