Where Walking and Biking Is Most Dangerous
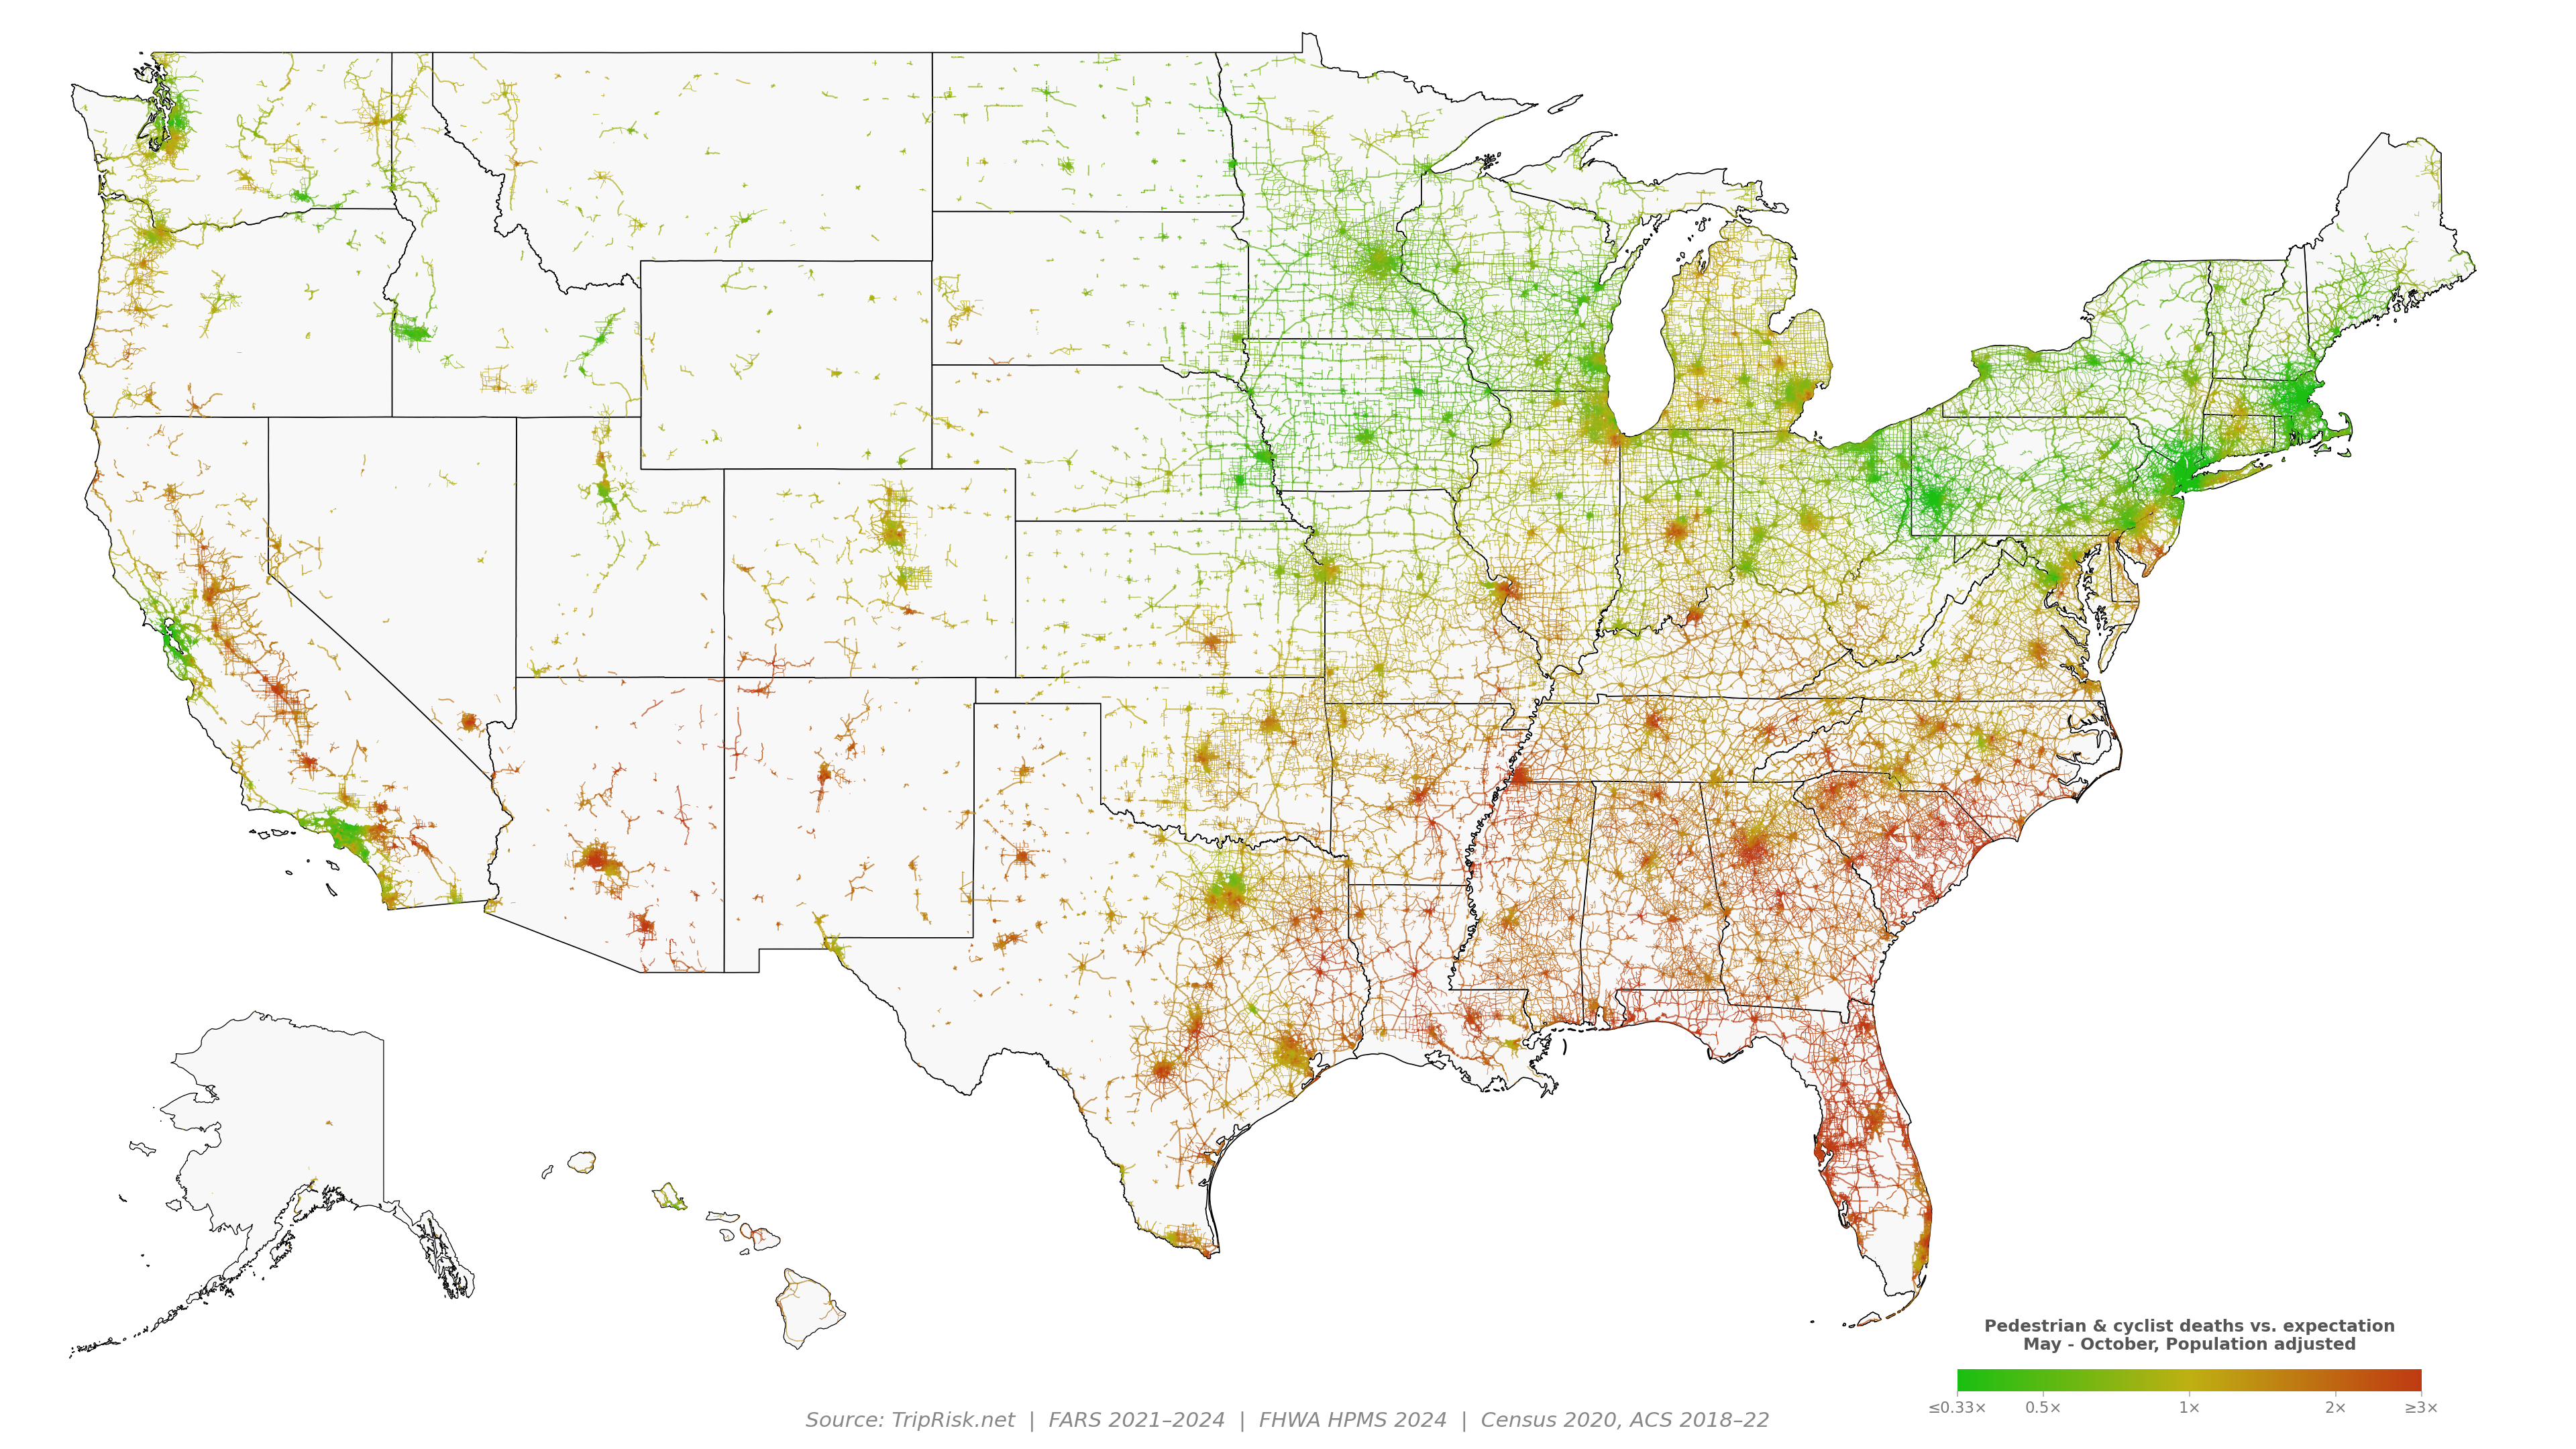
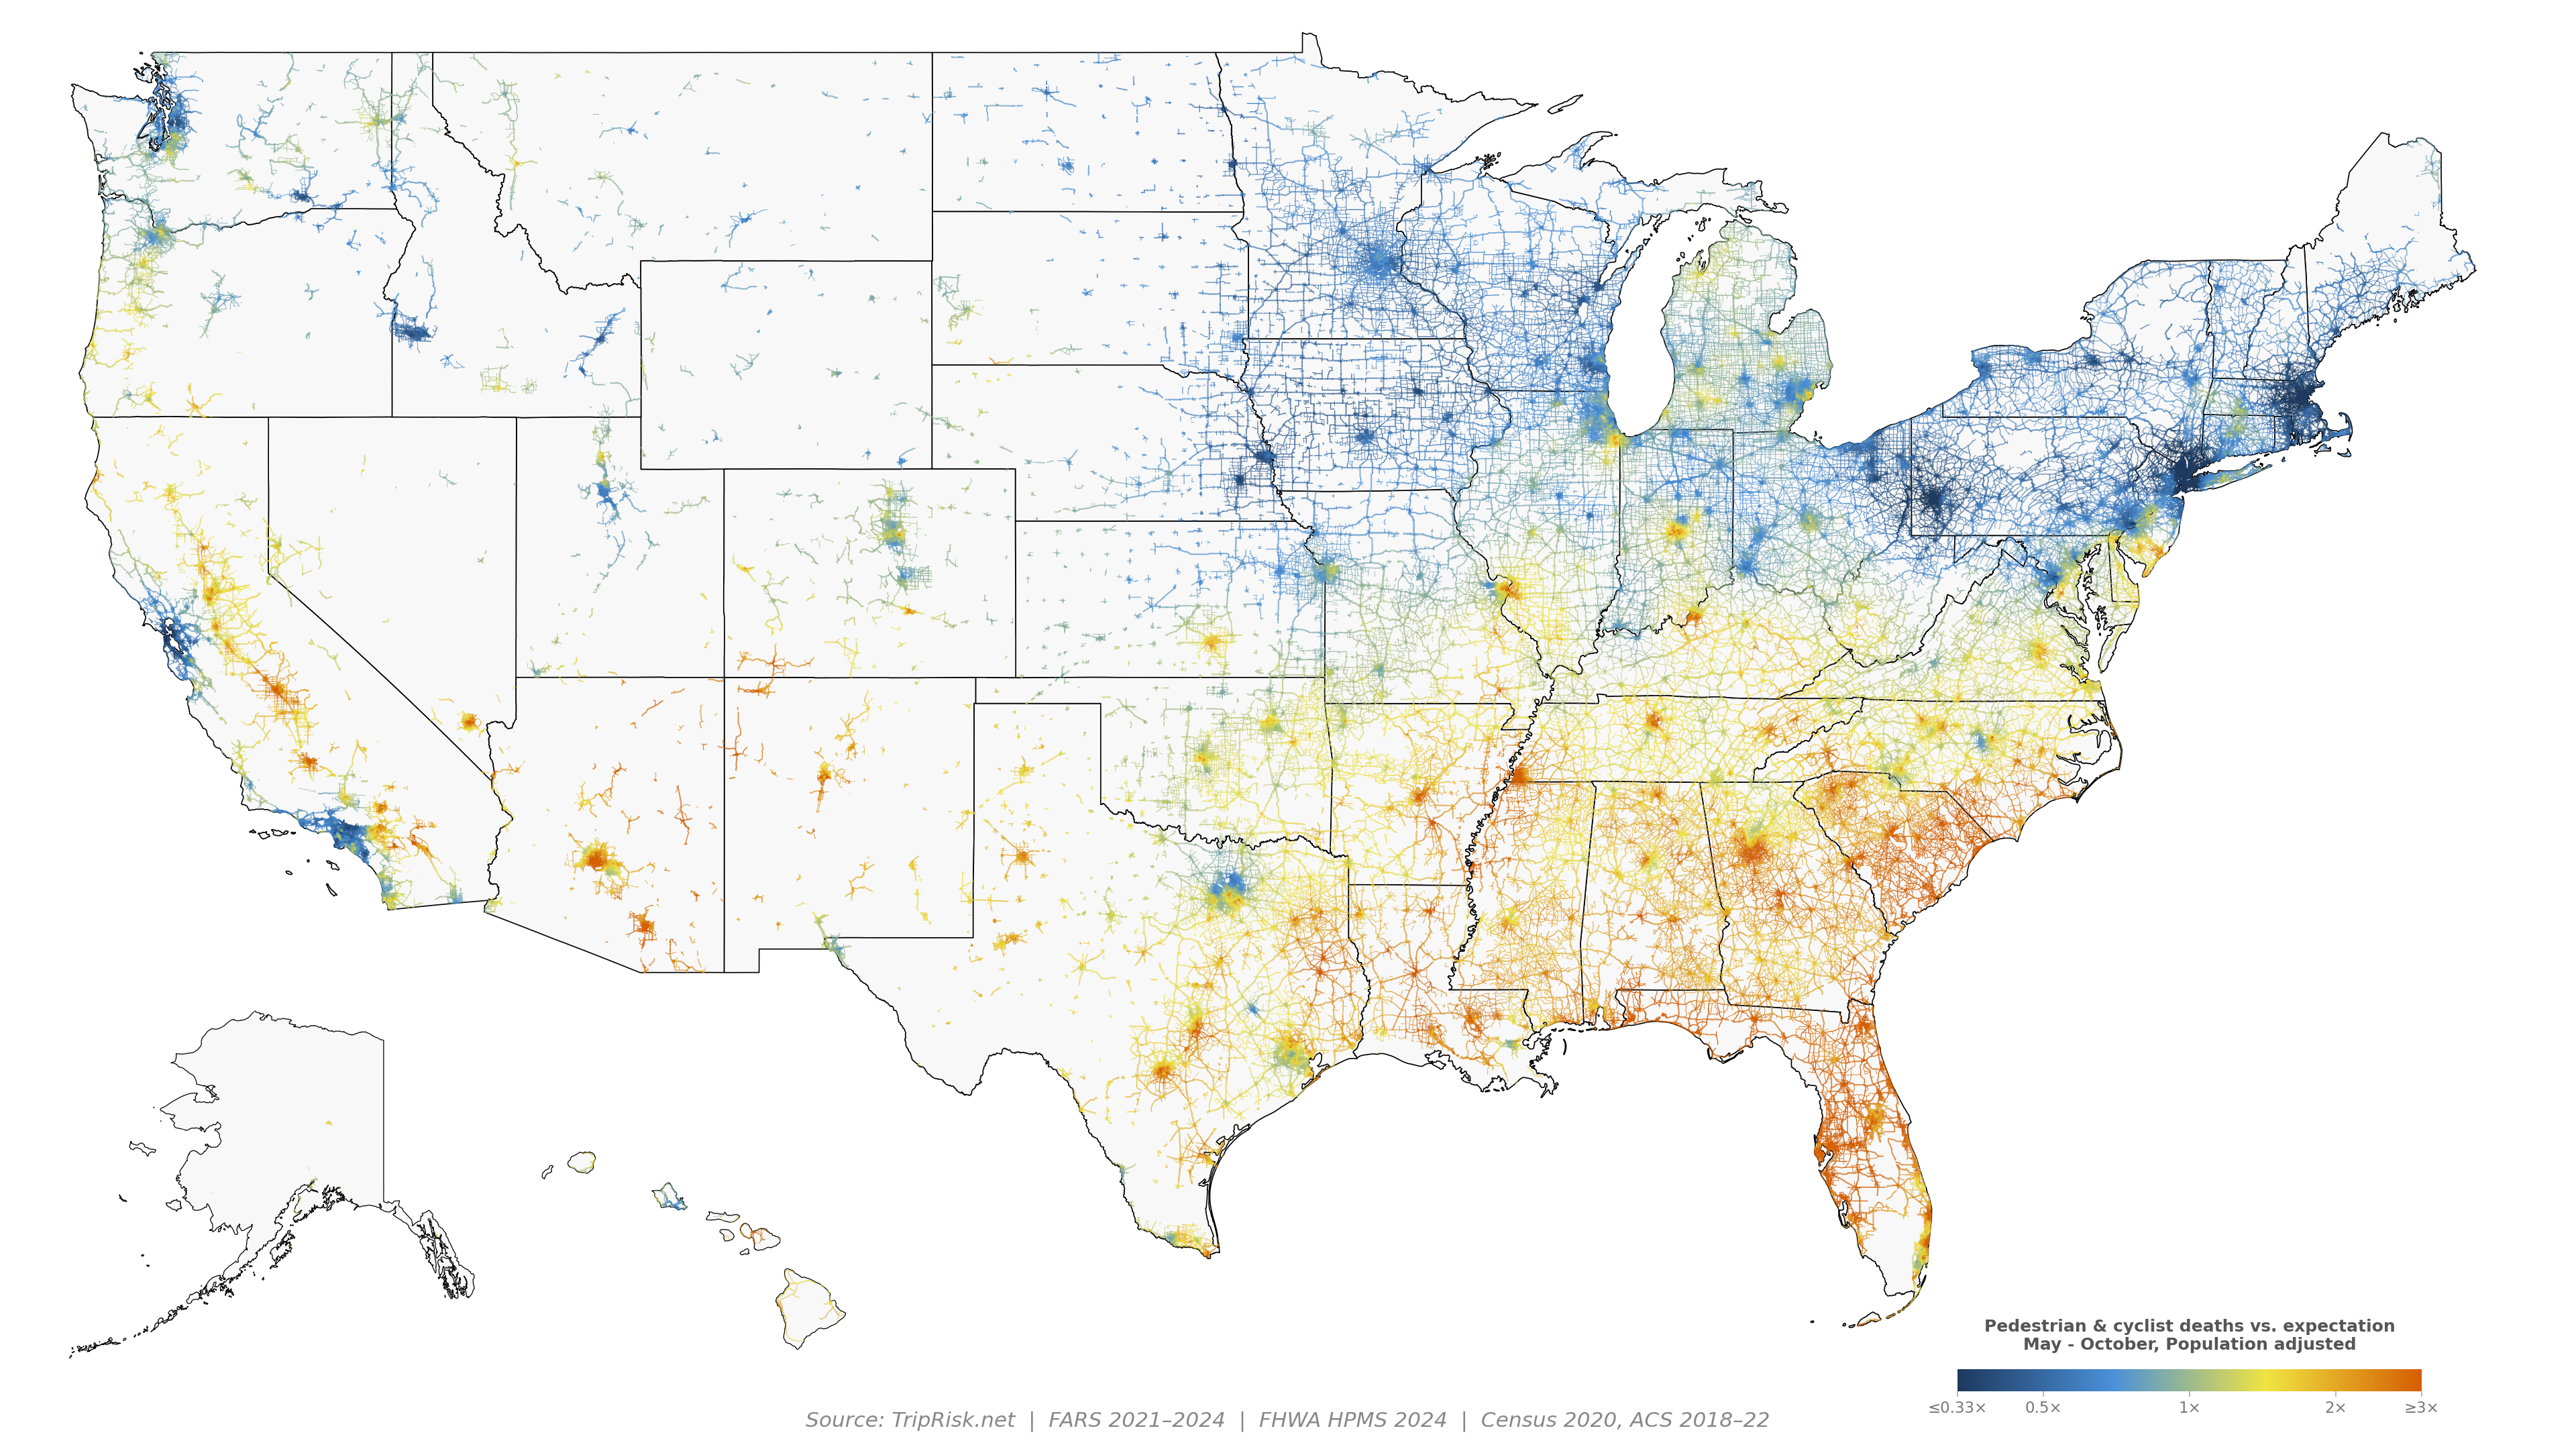
A road-by-road map of pedestrian and cyclist deaths across the US from May to October, adjusted for how many people live nearby.
Zoom in to expand a specific area.
Scroll to zoom, drag to pan
What the map shows
The road colors compare the number of pedestrians and cyclists killed there. The data is restricted to the warm months (May–October) to control for climate differences that reduce the number of pedestrians and cyclists (although including all months yields similar results).
These data are also adjusted for population because busy areas inherently have more pedestrians and cyclists. The map asks simply: for the people around a road, is it deadlier than it should be?
The Southeast and Sun Belt stand out. Florida, Georgia, the Carolinas, Louisiana, Arizona and California's Central Valley run well above expected.
The Upper Midwest and Northeast are mostly green, including dense cities like New York, Boston and Minneapolis.
Summer isn't the deadliest season. Only about half of pedestrian and cyclist deaths happen May–October; darker evenings in fall and winter carry much of the risk.
Method
Deaths include pedestrians and cyclists recorded by by NHTSA's Fatality Analysis Reporting System (FARS) from May–October 2021–2024. Fatalities are matched to the nearest road in the FHWA Highway Performance Monitoring System (HPMS 2024). Each road has a type and is corrected so that rural roads are compared against rural roads and highways are compared to highways, etc. The fatality rate is then adjusted based on the 2020 Census population within about 1 km of the road. Roads where cycling and walking are prohibited are not included. Very low population density roads are removed.