Pedestrian Fatality Risk Across America
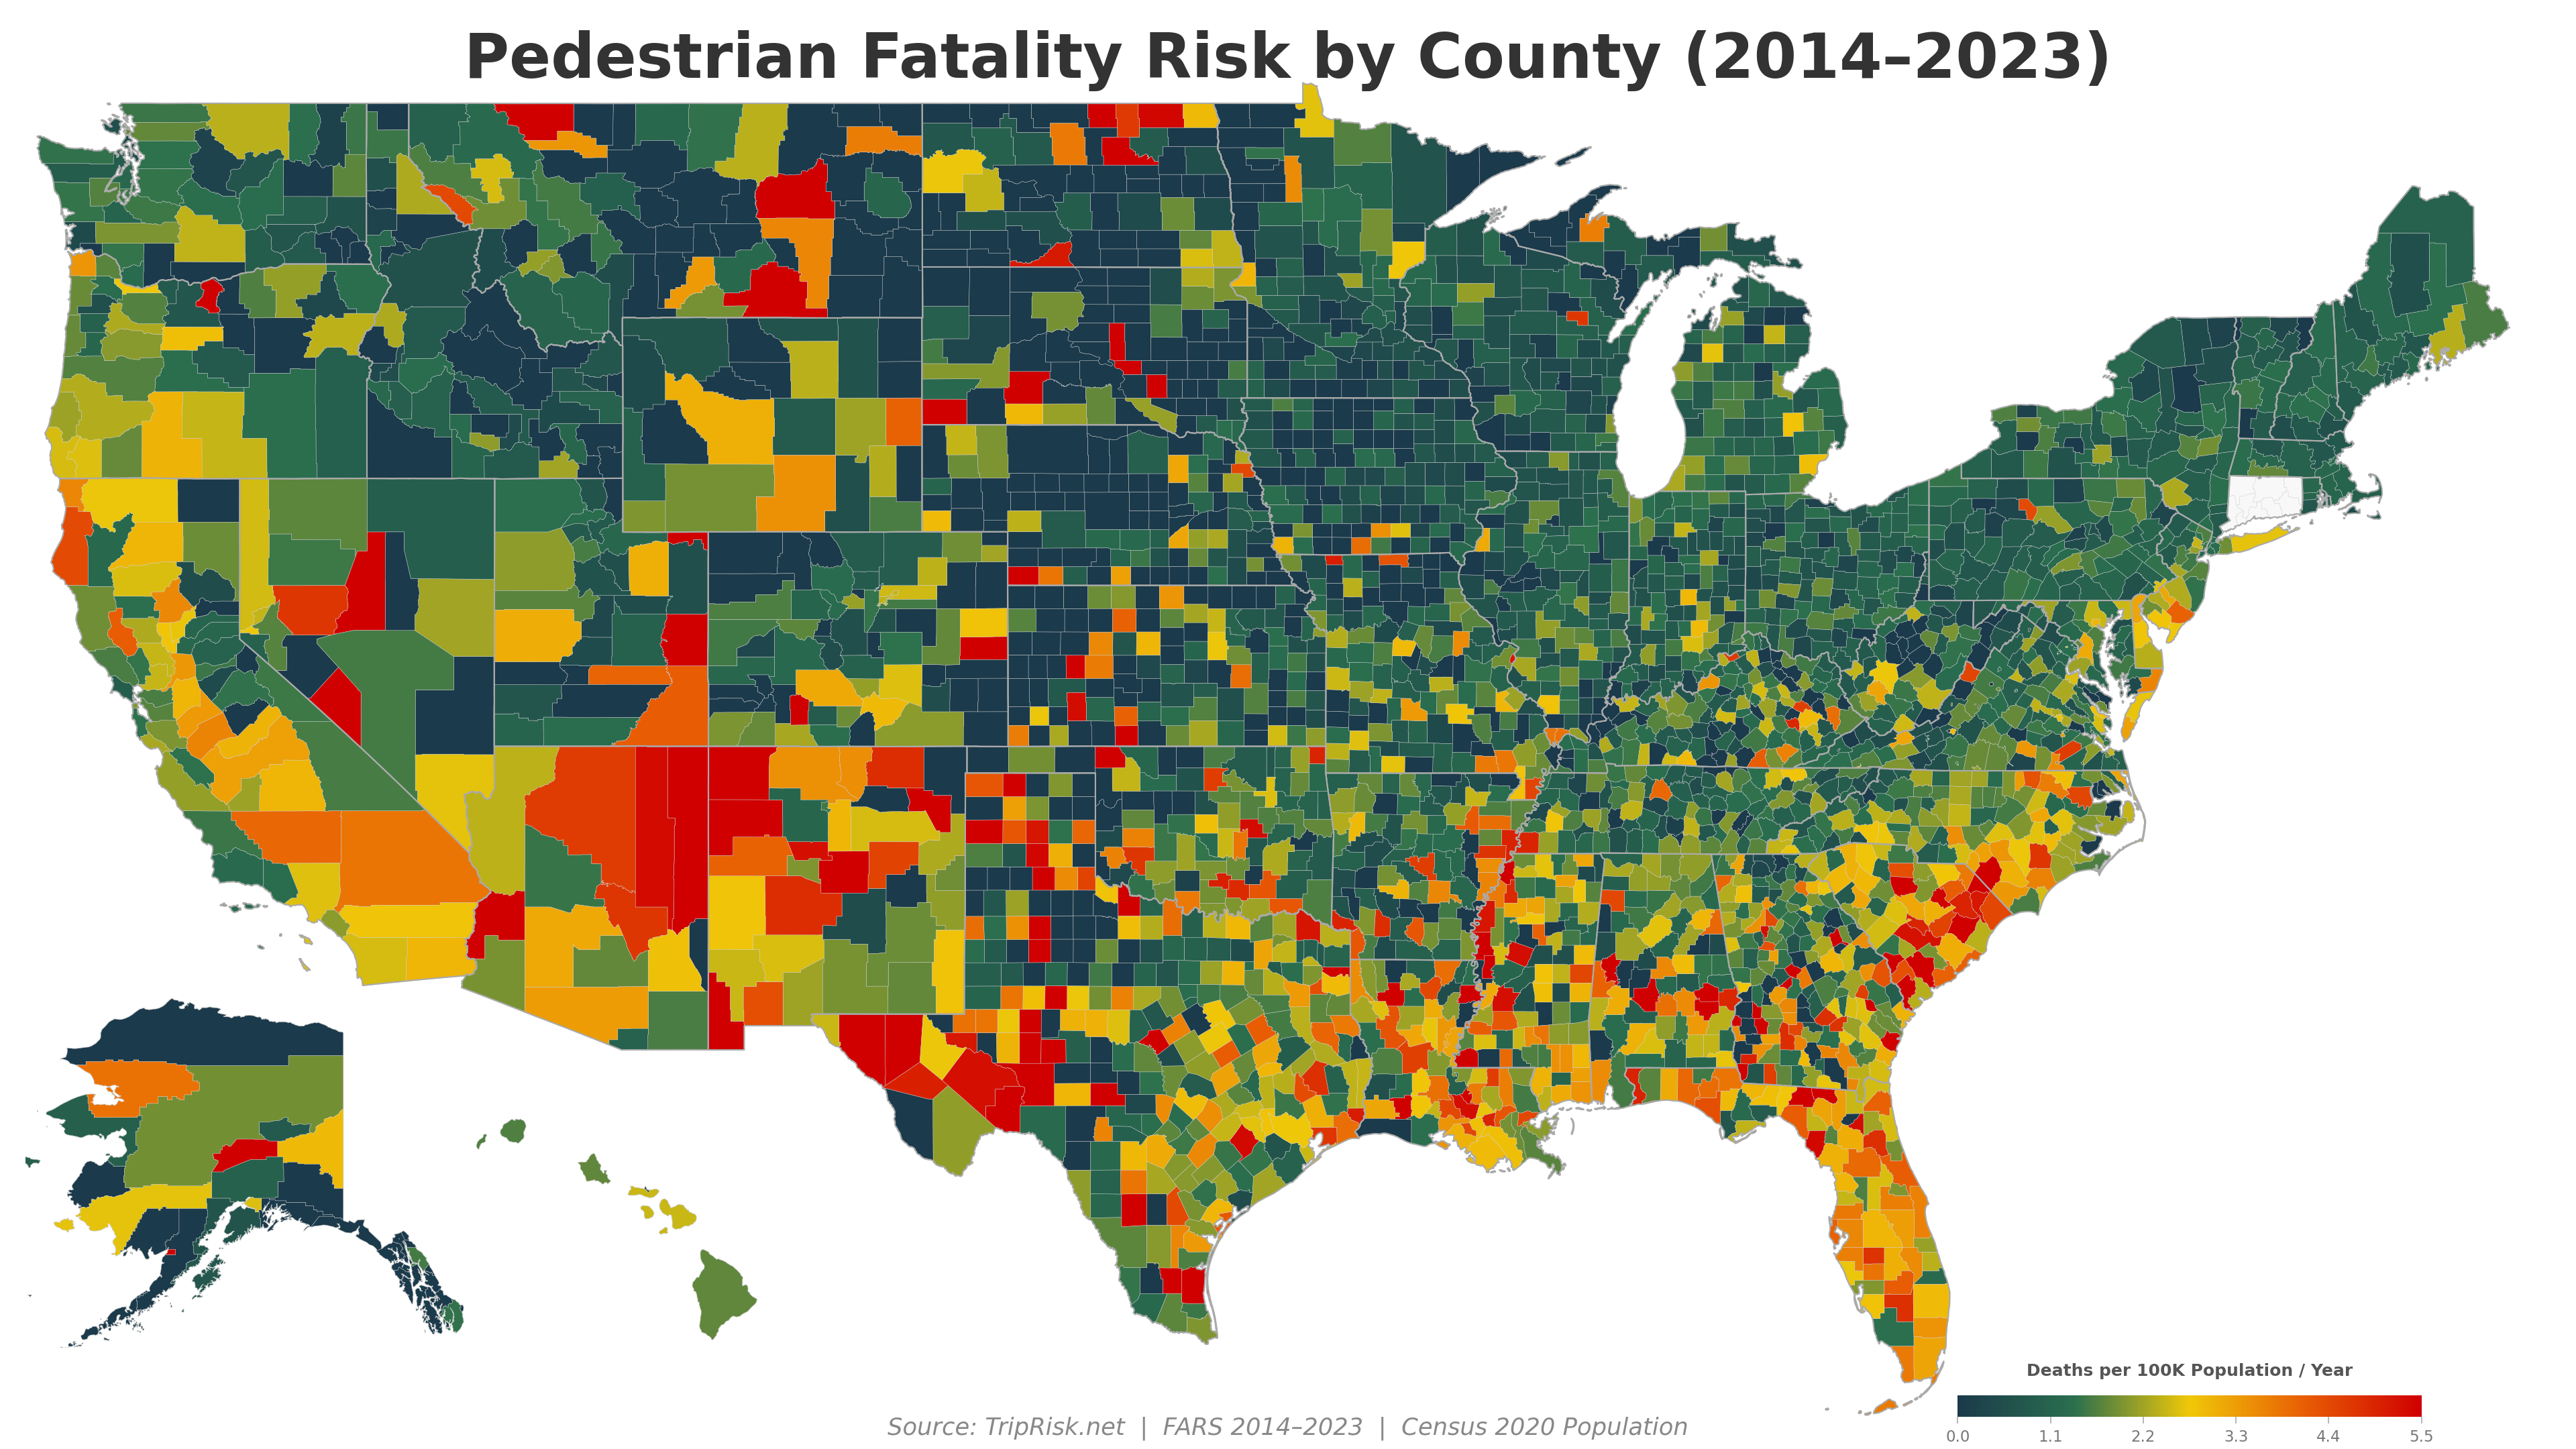
64,147 pedestrians killed on US roads from 2014 to 2023 — an average of 6,415 deaths per year and rising. We mapped every county to show where the risk is highest.
Pedestrian fatalities mapped over time
A Worsening Crisis
Pedestrian fatalities have surged 49% over the past decade, even as overall traffic deaths remained relatively flat. The increase accelerated during the pandemic years (2020–2022), driven by higher speeds, distracted driving, and the proliferation of larger vehicles.
The slight dip in 2023 offers cautious hope, but deaths remain far above the 2014 baseline.
Most Dangerous States for Pedestrians
New Mexico leads the nation at 3.89 deaths per 100K residents per year — more than 5x the rate of the safest states. The Sun Belt dominates the top of this list: warm climates mean more year-round pedestrian activity, often alongside high-speed arterial roads designed without sidewalks or safe crossings.
Florida, infamous for its pedestrian danger, ranks second despite its enormous population diluting per-capita numbers.
Safest States for Pedestrians
Northern and rural states dominate the safest list. Cold winters reduce pedestrian exposure, but these states also tend to have lower-speed urban cores and less sprawling arterial road design.
Most Dangerous Counties
Counties with population over 100,000, ranked by pedestrian fatality rate. Several patterns emerge:
- Native American reservations (San Juan Co. NM, Navajo Co. AZ) — high-speed highways through communities with limited pedestrian infrastructure
- Southern metro areas (Bibb/Macon GA, Hinds/Jackson MS, Shelby/Memphis TN) — sprawling cities with wide, fast arterials and poor transit alternatives
- Tourist/retirement destinations (Horry/Myrtle Beach SC, Escambia/Pensacola FL) — high pedestrian volumes on roads designed for cars
Why Are Pedestrian Deaths Rising?
Larger Vehicles
SUVs and trucks now make up 80% of new vehicle sales. A pedestrian struck by an SUV is 2-3x more likely to die than one struck by a sedan at the same speed.
Distracted Driving
Smartphone use while driving has increased steadily. Distracted drivers are less likely to see and stop for pedestrians, especially at dusk and dawn.
Road Design
Many US arterials are designed for speed, not safety. Wide lanes, long blocks, and missing crosswalks force pedestrians into dangerous situations.
Speed
The probability of a pedestrian fatality rises dramatically with impact speed: 10% at 23 mph, 50% at 42 mph, 90% at 58 mph.
Night-Time Risk
75% of pedestrian fatalities occur after dark. Inadequate street lighting and dark clothing compound the visibility problem.
Sprawl & Transit
Cities built around cars force pedestrians onto high-speed roads. Areas with poor public transit have more people walking along dangerous corridors.
Where Is It Getting Worse?
To quantify the crisis, we compared pedestrian fatality rates from 2014–17 to 2020–23 for every US county. The result is stark: 59% of counties saw their pedestrian death rate increase, while only 30% improved.
The map below shows the change in annual pedestrian deaths per 100,000 residents. Red counties are getting more dangerous for pedestrians; blue counties are improving.
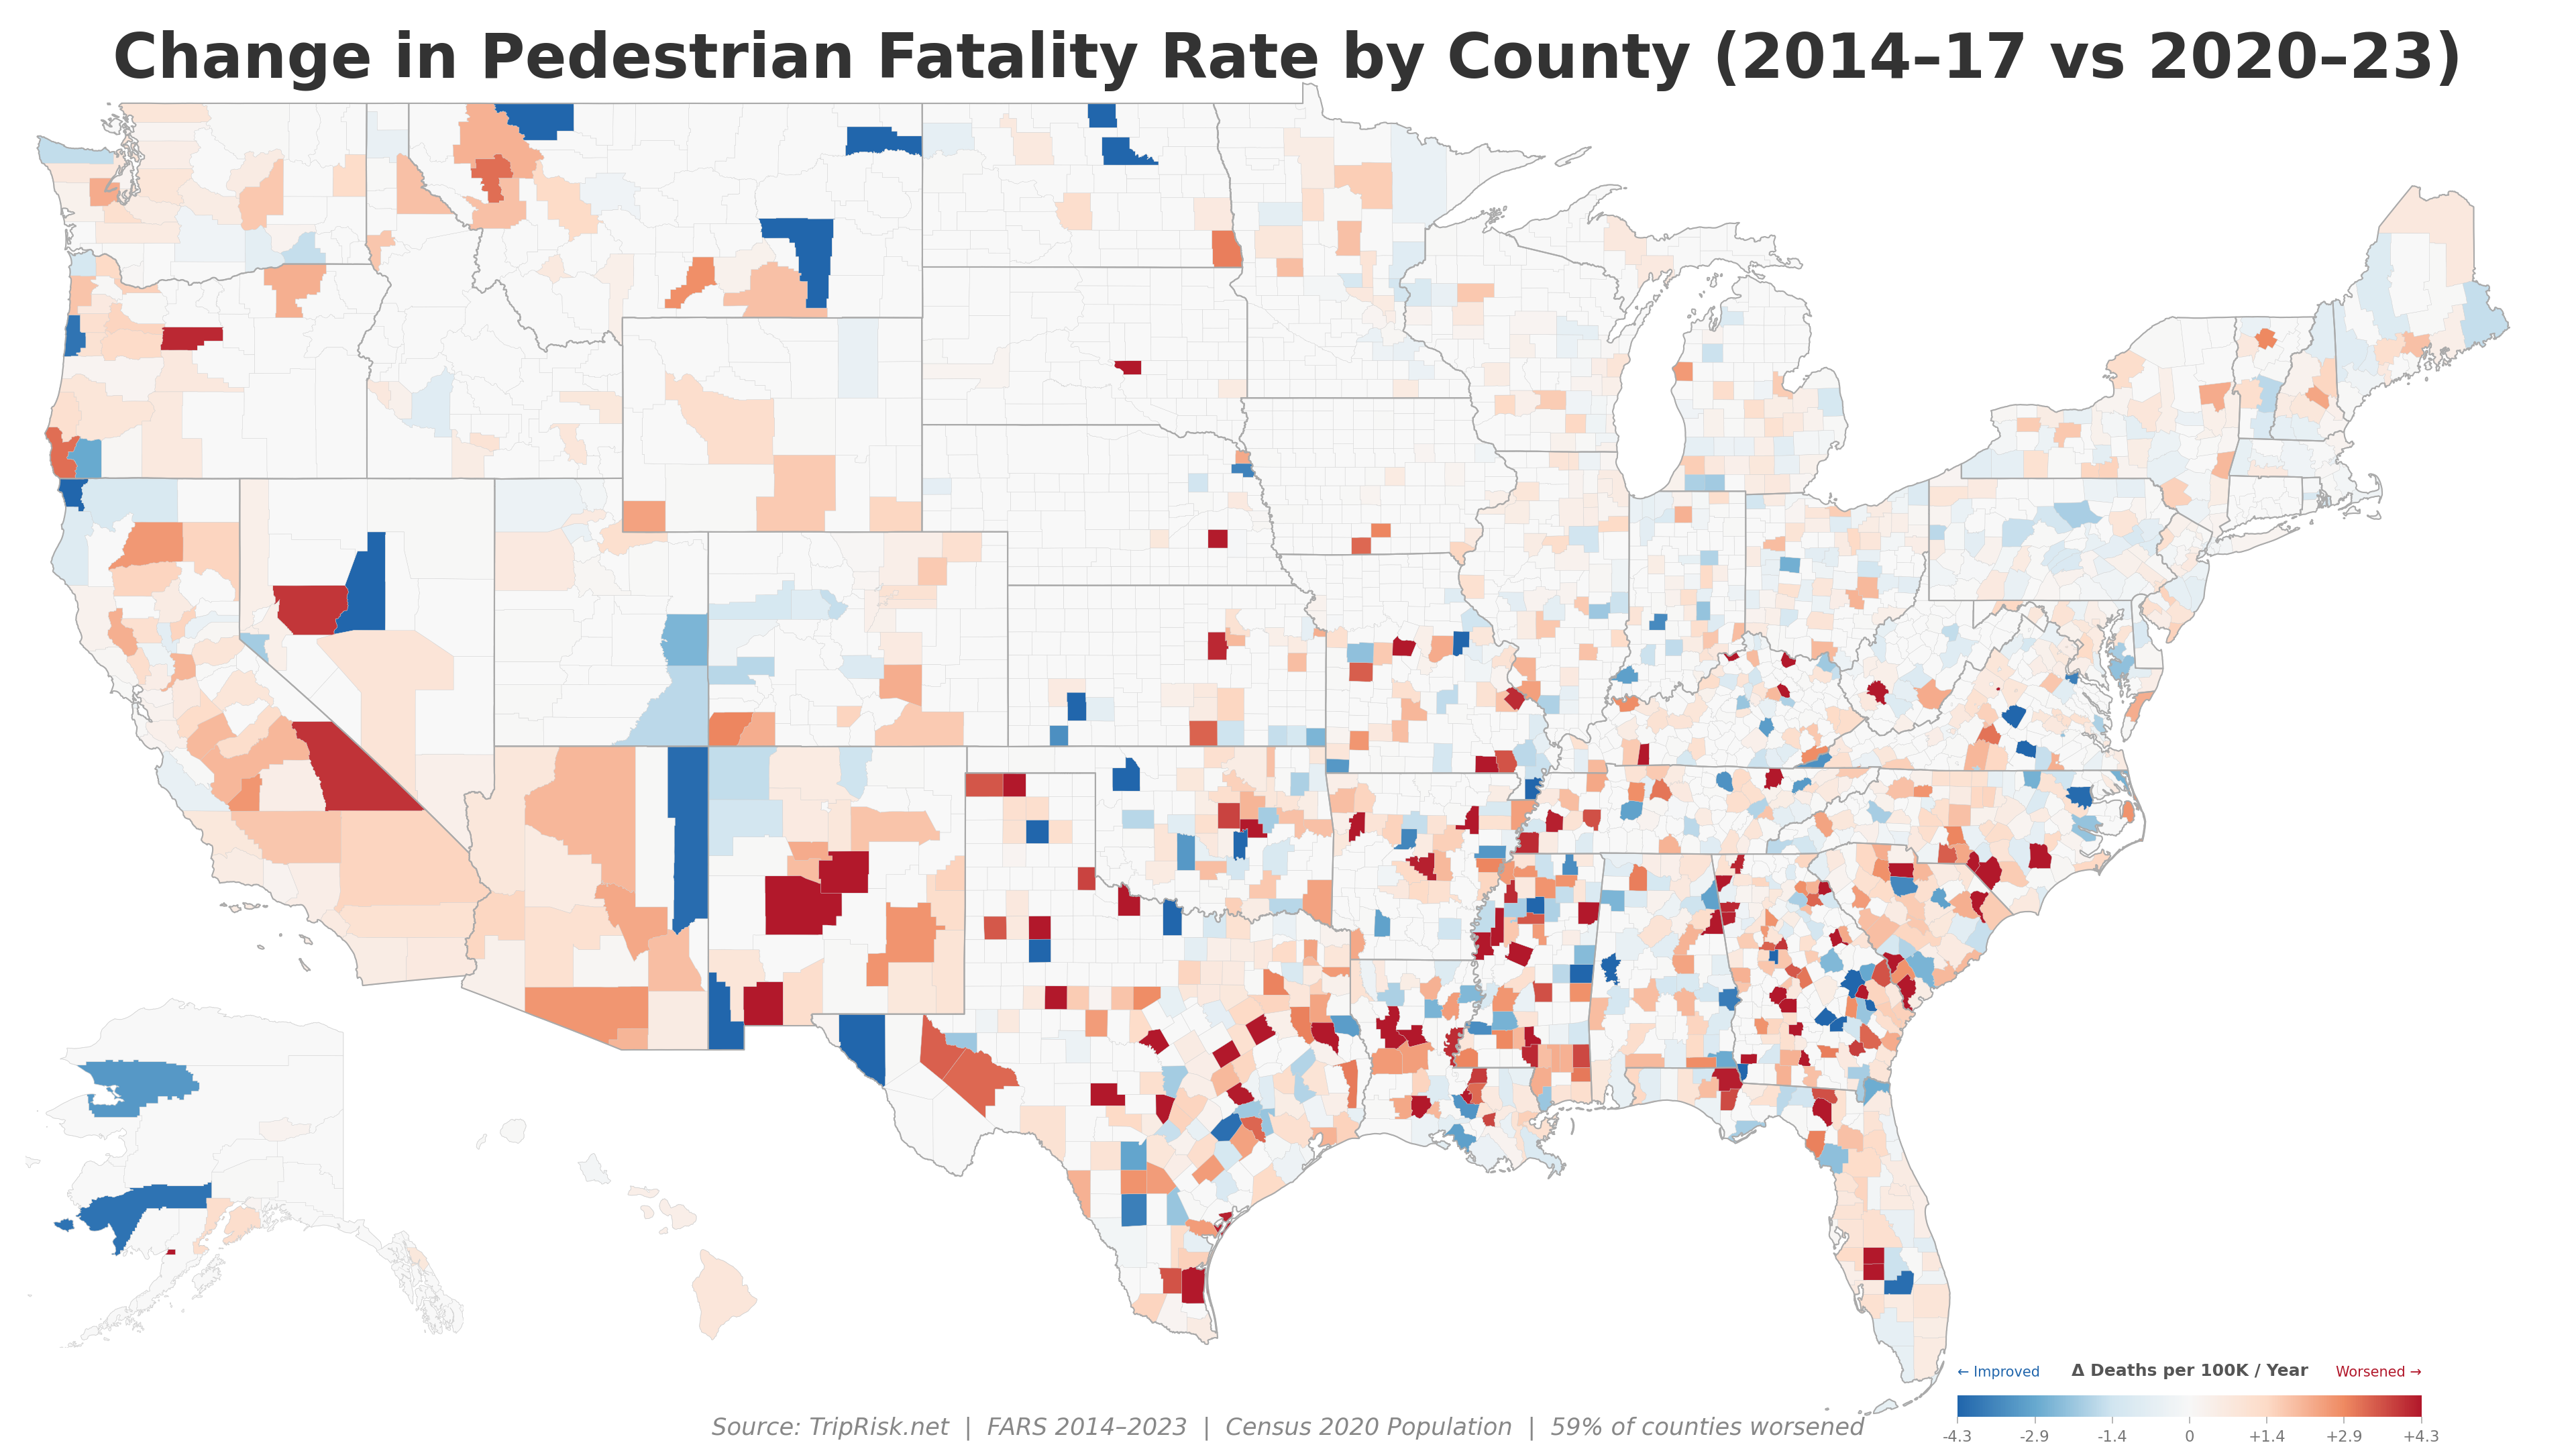
The geographic pattern is striking. The Southeast, Southwest, and Mountain West show widespread worsening, with states like Arkansas (+1.5/100K), Tennessee (+1.5/100K), and New Mexico (+1.3/100K) seeing the sharpest increases. Meanwhile, the Northeast — New York, Massachusetts, Rhode Island, Maine — has remained largely stable.
Notably, the worsening is not limited to rural or urban areas. Counties of all population sizes saw similar average increases, suggesting the problem is systemic rather than geographic.
- 2014–2017: ~5,640 deaths/year
- 2020–2023: ~7,236 deaths/year (+28%)
Colorblind-Accessible Version
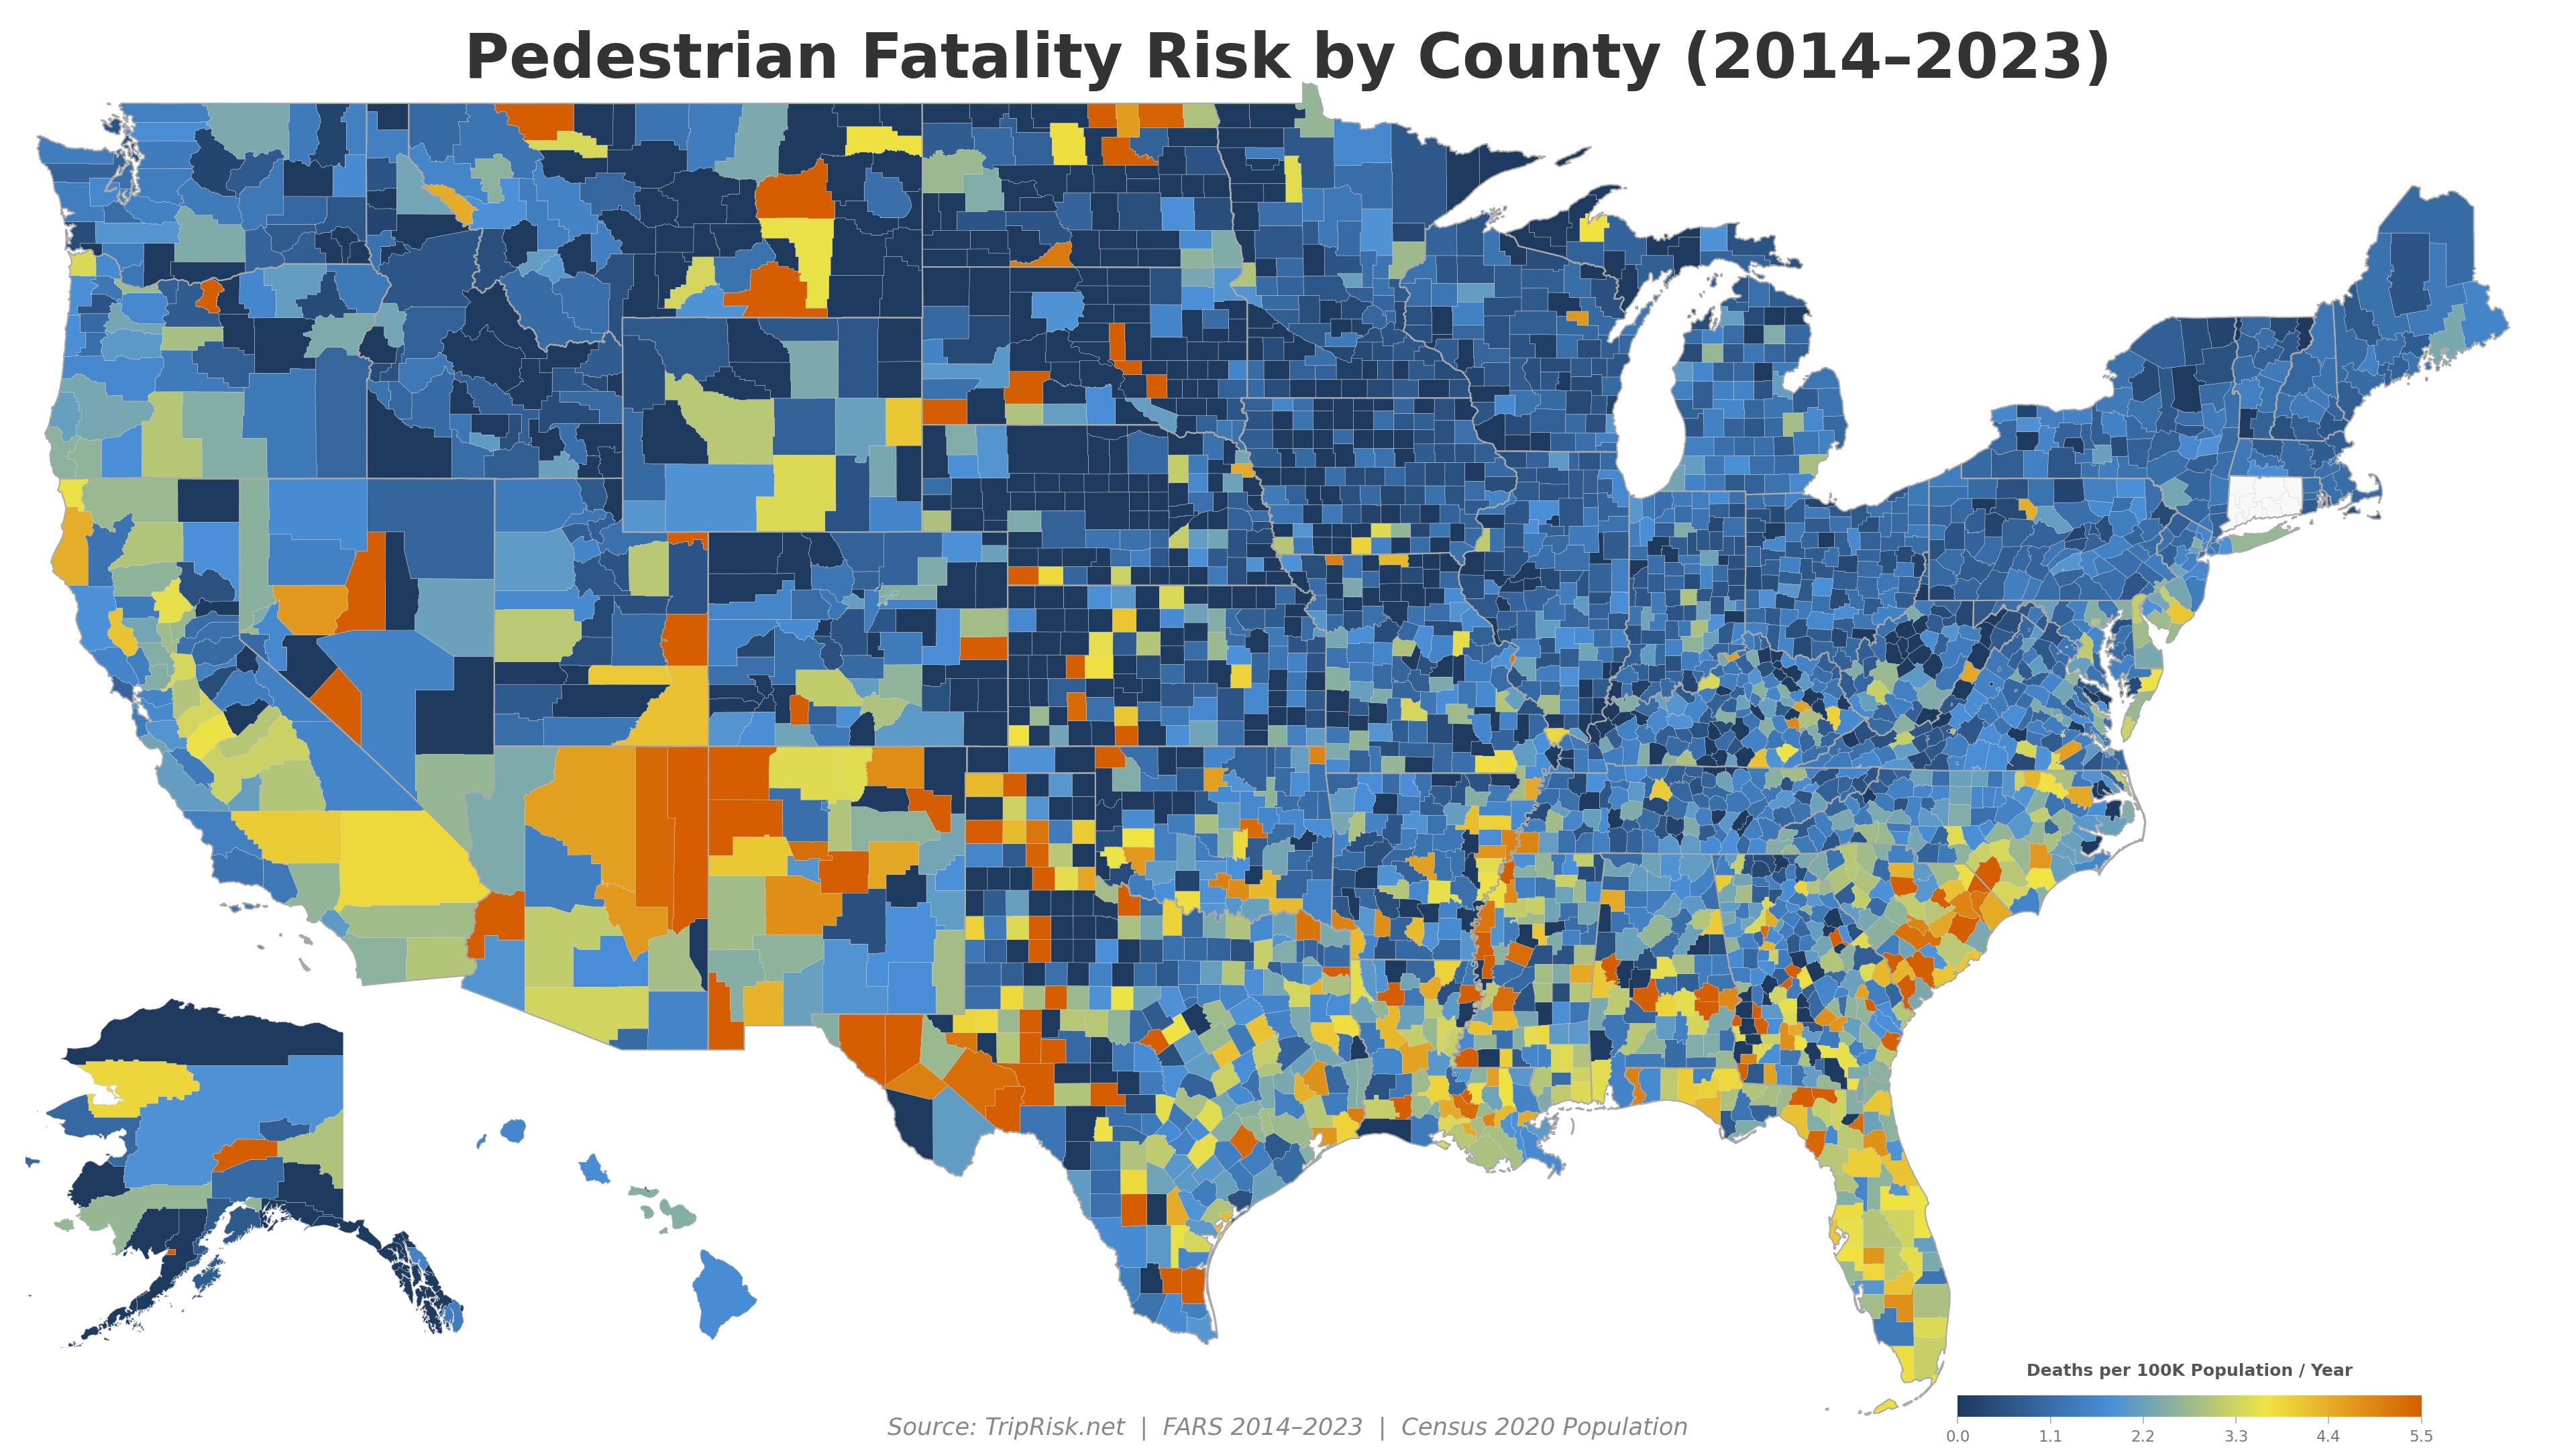
The same data rendered with a blue–yellow–orange color scale, designed for readers with color vision deficiency.
State Comparisons
New Mexico vs Minnesota
New Mexico: 3.89 per 100K Minnesota: 0.73 per 100K
A pedestrian in New Mexico is 5.3x more likely to be killed than one in Minnesota. NM has high-speed highways running through tribal communities and small towns with minimal pedestrian infrastructure. Minnesota invests heavily in winter-safe sidewalks and traffic calming.
Florida vs New York
Florida: 3.25 per 100K New York: 1.43 per 100K
Despite NYC having far more pedestrians, Florida's rate is 2.3x higher. Florida's wide, high-speed arterials (US-19, US-1, SR-7) are among the deadliest roads in America for pedestrians. NYC's density, lower speeds, and Vision Zero investments provide better protection.
Albuquerque vs Portland
Bernalillo Co. (Albuquerque): 5.26 per 100K Multnomah Co. (Portland): ~1.8 per 100K
Both are mid-size Western cities, but Albuquerque's rate is nearly 3x higher. Portland's protected bike lanes, lower speed limits, and neighborhood greenways create a fundamentally different pedestrian environment.
Memphis vs Nashville
Shelby Co. (Memphis): 4.96 per 100K Davidson Co. (Nashville): ~3.2 per 100K
Two Tennessee cities with very different outcomes. Memphis's sprawling layout and wide stroads create deadly conditions. Nashville, while still above the national average, has invested in sidewalk construction and pedestrian signal improvements.
Enter any two US addresses and compare the fastest vs safest driving route.
Pan and zoom the full interactive map with road-level risk coloring anywhere in the US.
Data Sources
- NHTSA FARS — Fatality Analysis Reporting System, person-level data 2014–2023
- US Census Bureau — 2020 Decennial Census county population
- Census Bureau — County boundary shapefiles (2022 TIGER/Line)
Pedestrian fatalities are identified by FARS person type code 5 (pedestrian struck by vehicle in transport) with injury severity 4 (fatal). County attribution uses the crash location from the accident-level record.
For our full road-level analysis, see the US Road Risk page. For methodology details, see the methodology page.