US Road Fatality Risk Map — Colorblind-Friendly
US Road Fatality Risk Map — Colorblind-Friendly Version
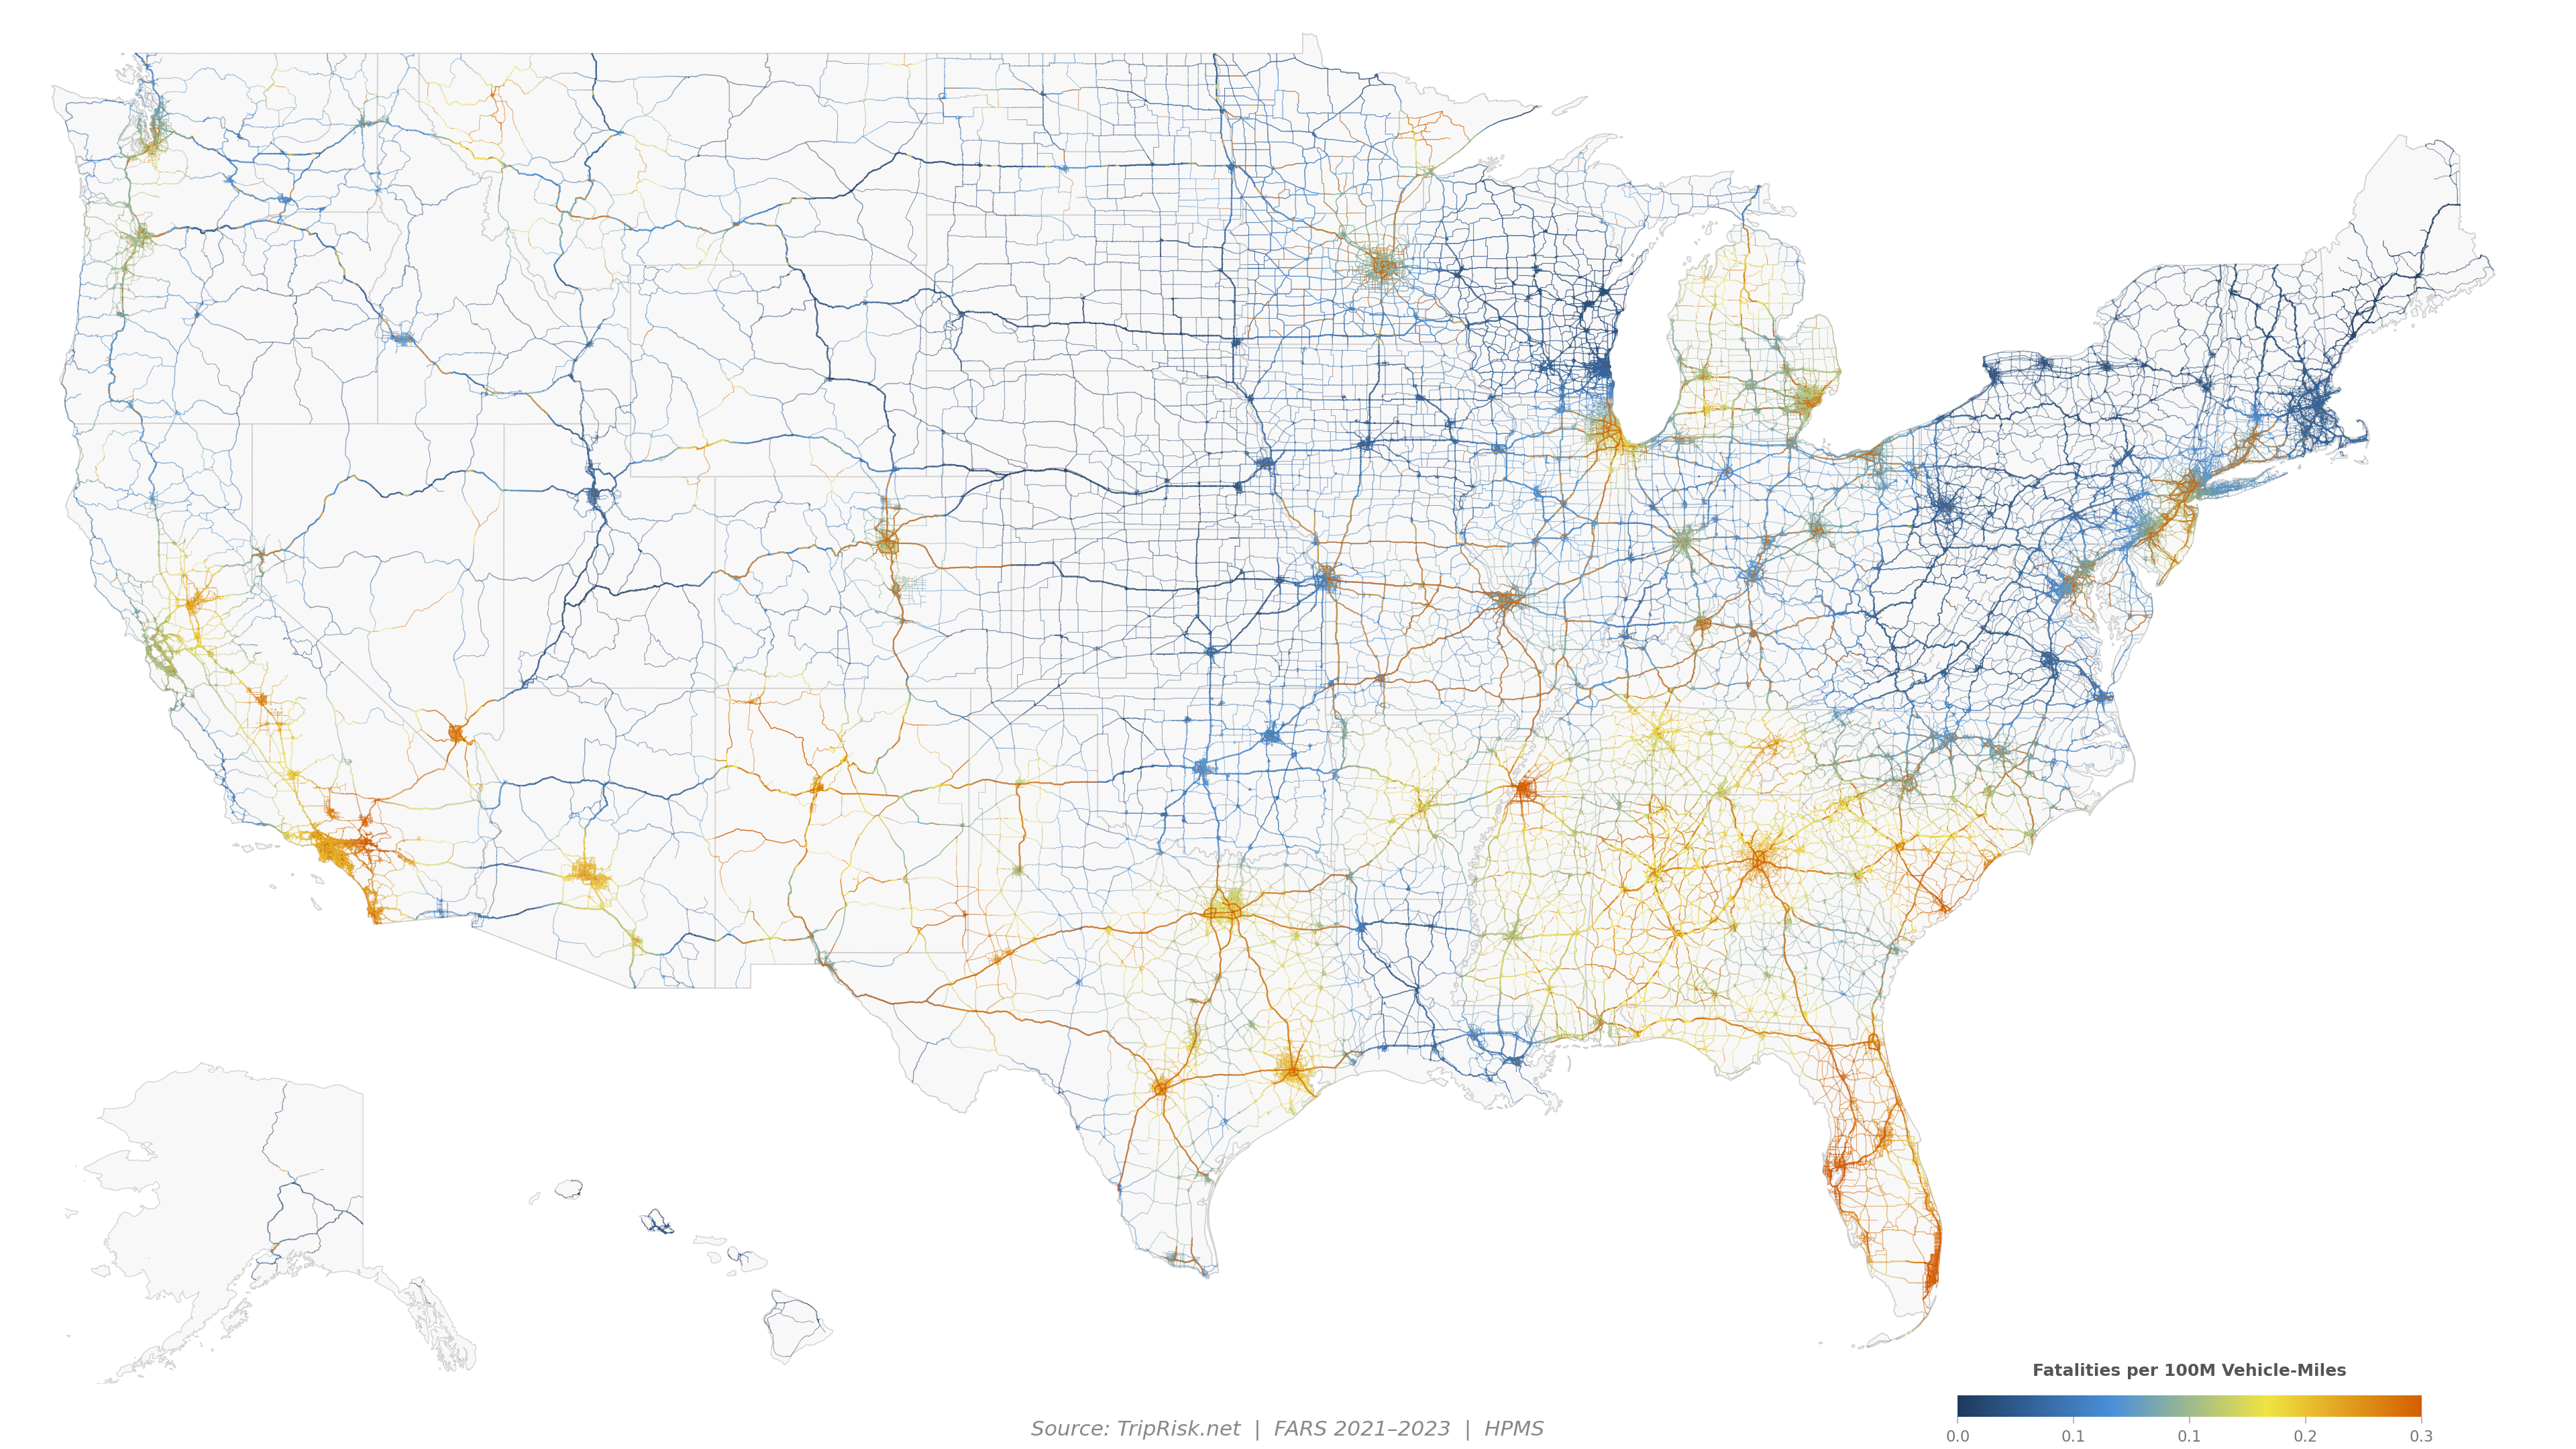
This is an alternate rendering of our US road fatality risk map using a blue → yellow → orange color ramp that is safe for all common types of color vision deficiency (deuteranopia, protanopia, and tritanopia).
Blue = safest roads, yellow/orange = most dangerous. The data and methodology are identical to the original map.
About the data
Every colored line is a real road segment from the FHWA Highway Performance Monitoring System (HPMS), colored by its fatality rate using NHTSA FARS crash data (2021–2023). The map covers functional classes 1–4 (Interstate through Minor Arterial) across all 50 states.
For the full interactive analysis with charts, state rankings, and city comparisons, see the complete US Road Risk page →.
Pan and zoom with road-level risk coloring anywhere in the US.
Compare fastest vs safest driving routes between any US addresses.